

Hallmarks of so called digital enterprise companies are that they are able to mirror and refine the real-world way of conducting business in the digital world, and in some cases even blur the boundaries between the two.
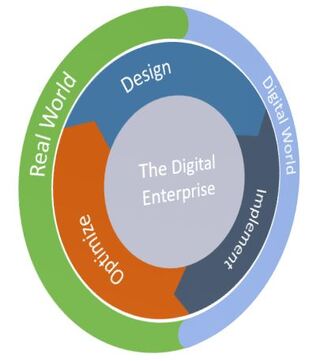 | Such companies design their business processes (their “ways of working”), implements them digitally, executes, and measures their processes continuously. The measurements are then used to optimize and adjust the business processes both in the real and digital world. |
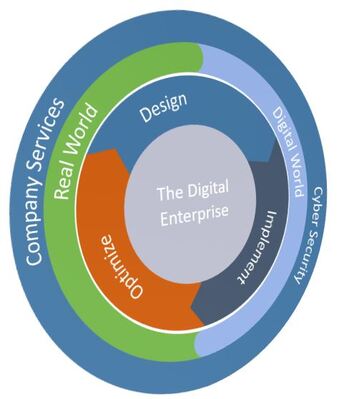
Emphasis is put on company services being protected by cyber security measures to safeguard both the services and the company itself
Companies that have focused on this are more able to continuously improve as well as detect, adapt, and transform to changes, opportunities and threats in their business environment.
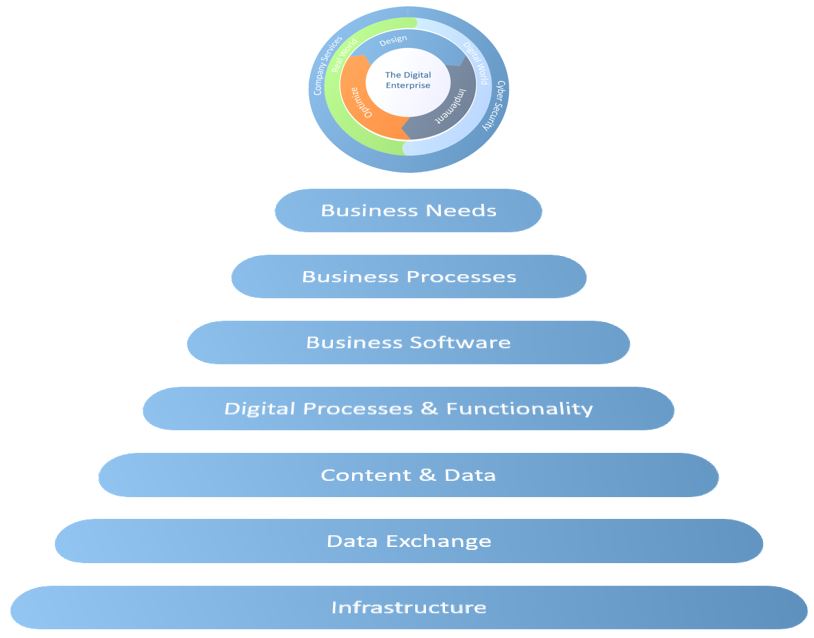
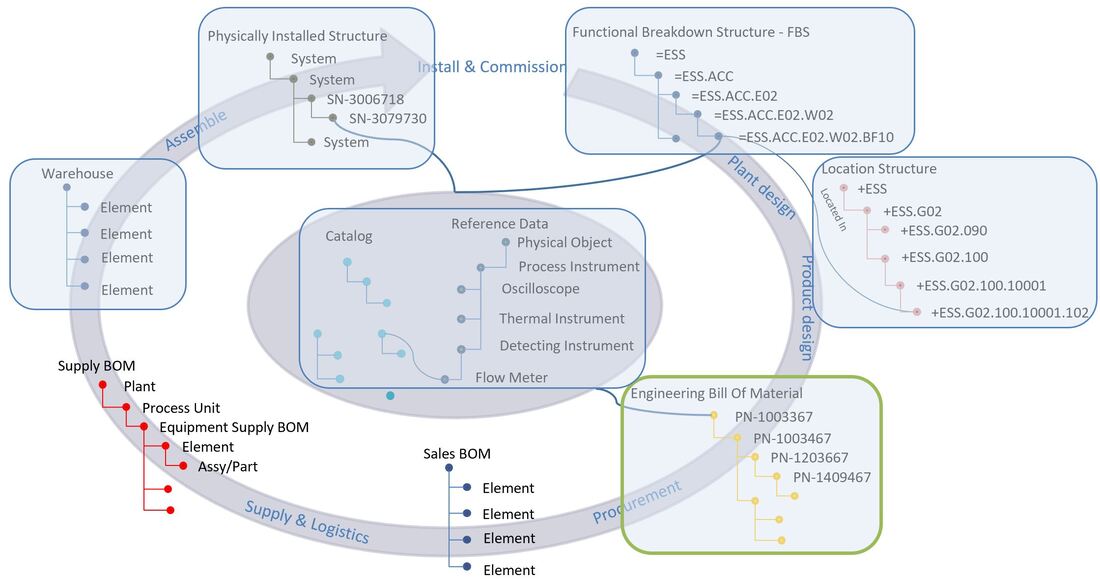
To make this work, as per the figure below, business needs must be catered for by defined business processes ("the way we work")
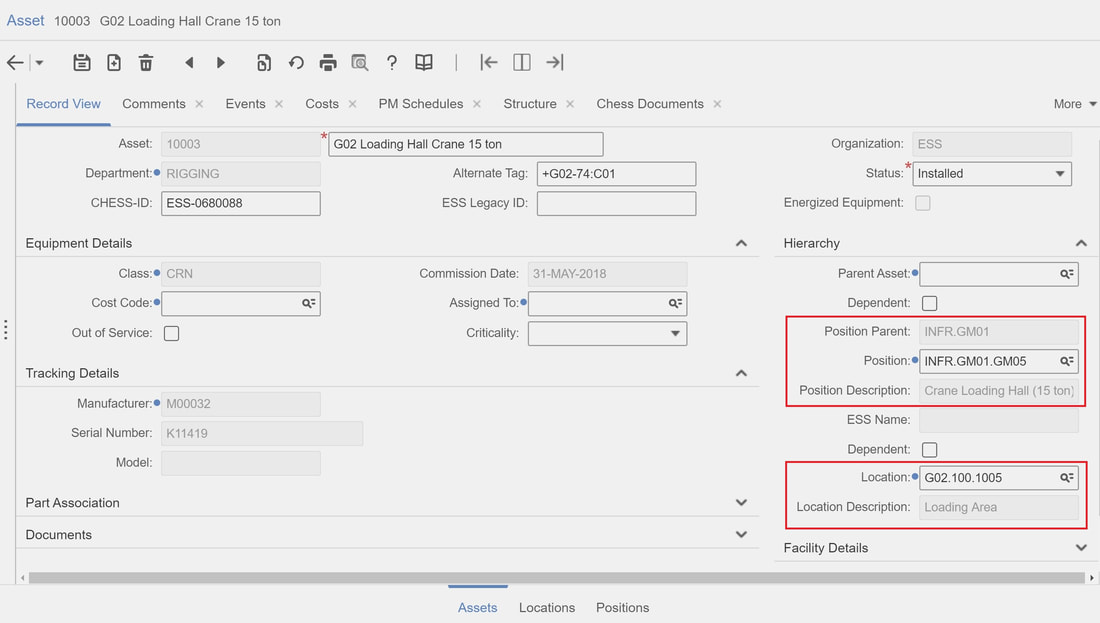
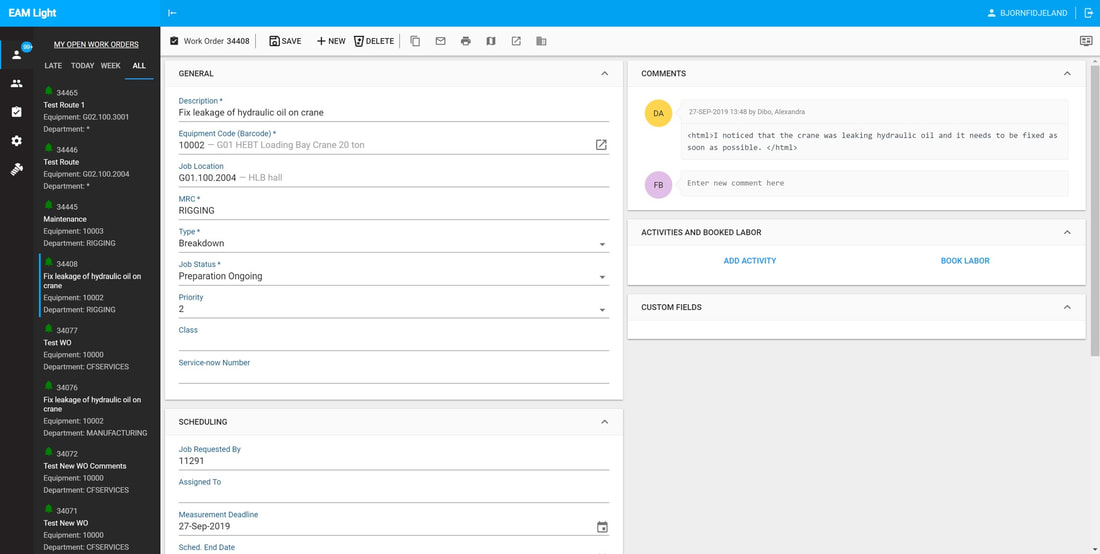
The defined business processes must be implemented by digital counterparts in enterprise business software
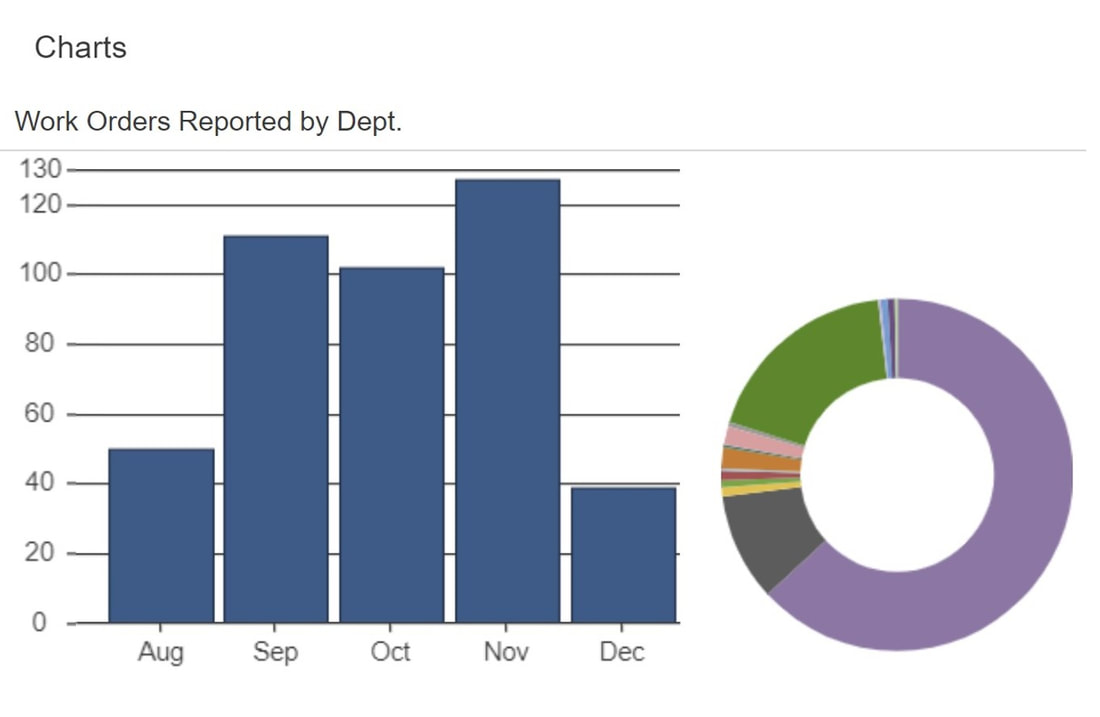
Data and content produced when executing the processes must be analyzed, measured and managed to provide actionable insight
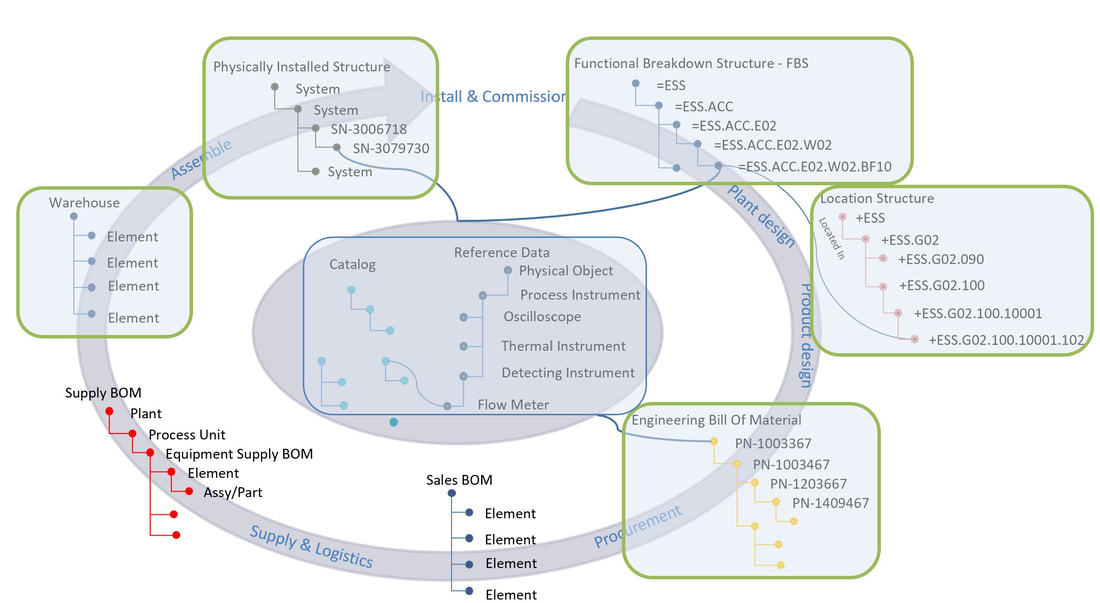
Data exchanges must be interoperable to support cross cutting processes and data transfer or even better, linking of data, between enterprise business software when needed.
An infrastructure of hardware and software capable of running the enterprise business software is the foundation for it all
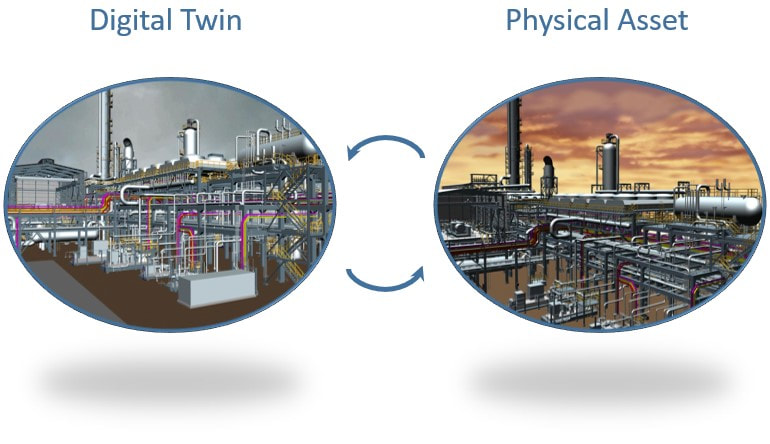
In my article series "PLM Tales from a true mega project" and more specifically in Chapter 8 - Digital Twin I wrote:
"The thing is…. In order to achieve what is described in this article series, most companies would have to change the way they are currently thinking and working across their different departments, which brings us to the fact that real business transformation would also be required. The latter is most of the time a much larger and more time-consuming obstacle than the technical ones because it involves a cultural change."
So while the "PLM Tales from a true mega project" and "Plant Information Management" articles focused on the information that needs to be managed and how this may be done, this and articles to come will focus on how the business may be transformed as well as the governance needed to make it happen.
Bjorn Fidjeland


 RSS Feed
