Follow us at
plmPartner
  • Home
  • About
  • Blog
  • Archive
  • Contact
  • Video Log
  • Learning Center
  • Privacy Policy

Big Data and PLM, what’s the connection?

1/3/2018

3 Comments

 
Picture
I was challenged the other day to explain the connection between Big Data and PLM by a former colleague. The connection might not be immediately apparent if your viewpoint is from traditional Product Lifecycle Management systems which primarily has to do with managing the design and engineering data of a product or plant/facility.

However, if we first take a look at a definition of Product Lifecycle Management from Wikipedia:

“In industry, product lifecycle management (PLM) is the process of managing the entire lifecycle of a product from inception, through engineering design and manufacture, to service and disposal of manufactured products. PLM integrates people, data, processes and business systems and provides a product information backbone for companies and their extended enterprise.”
​
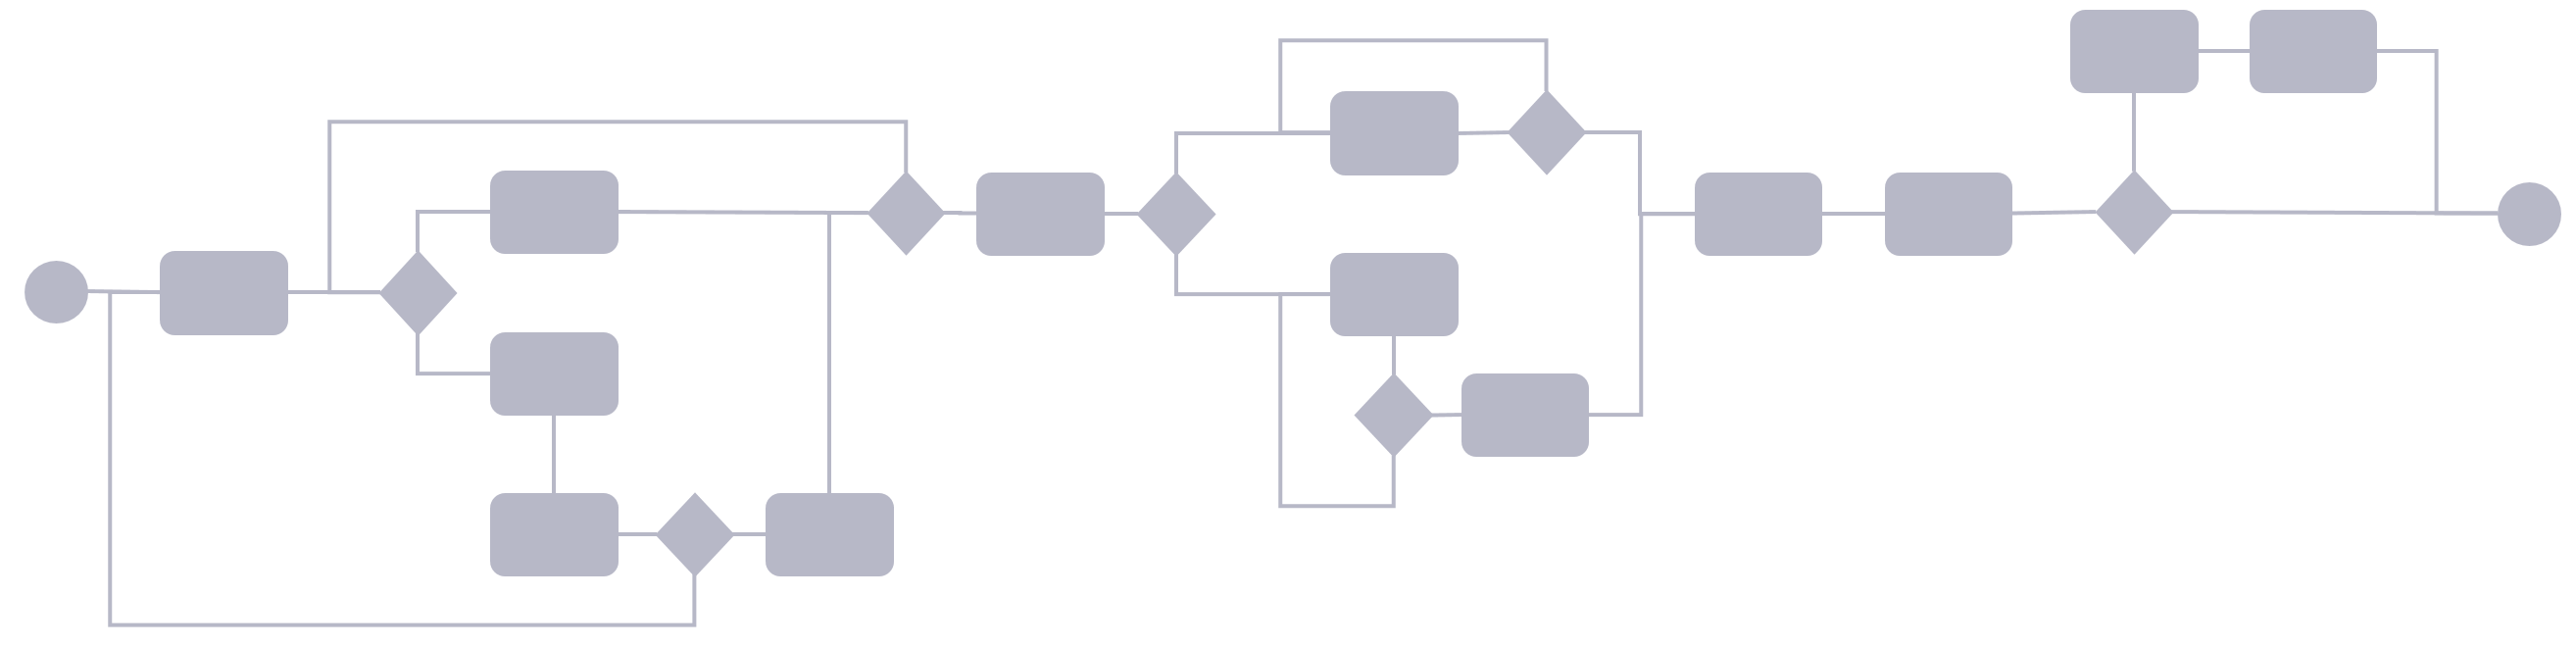
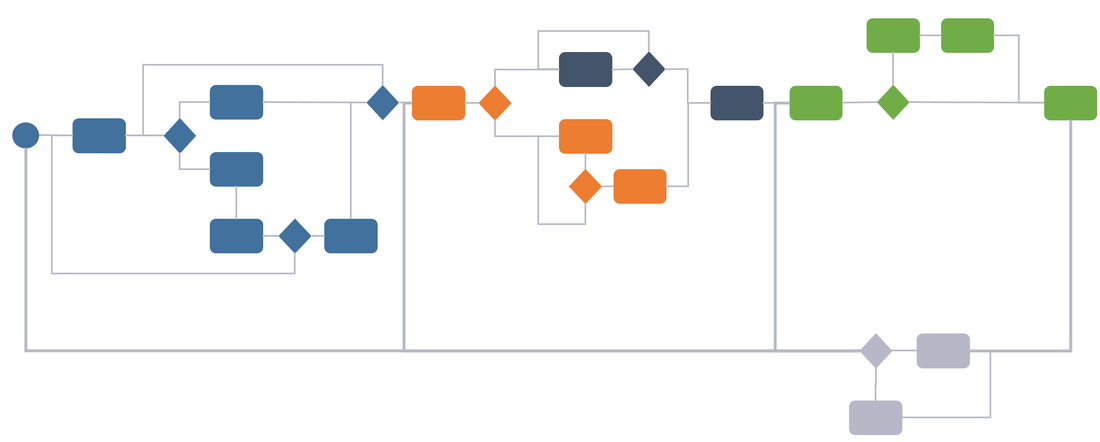
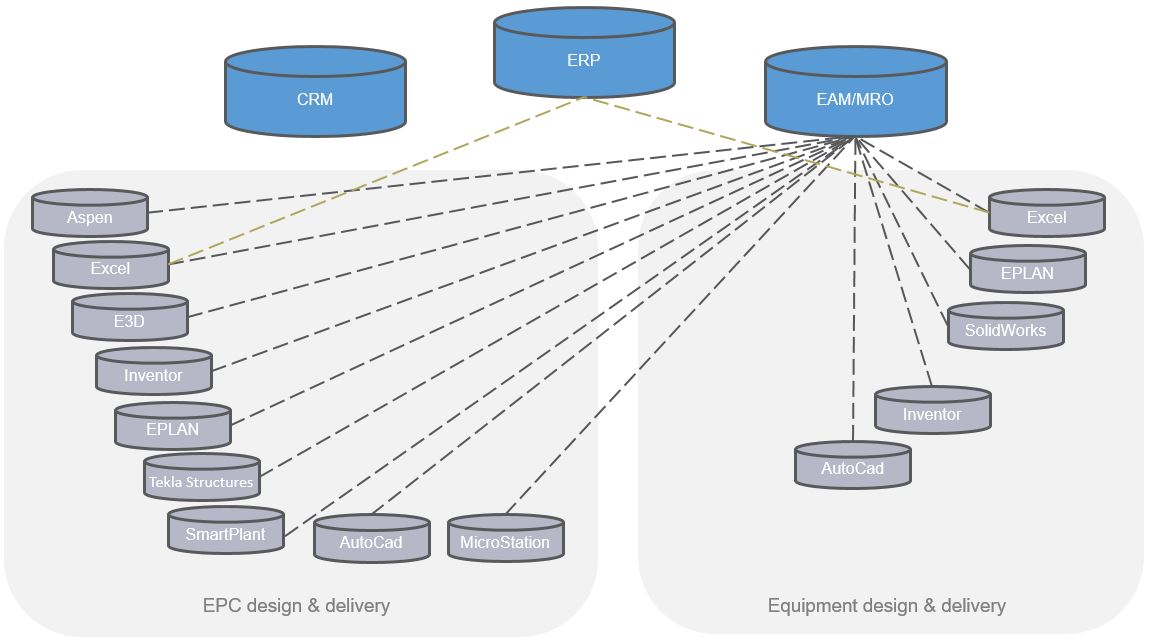
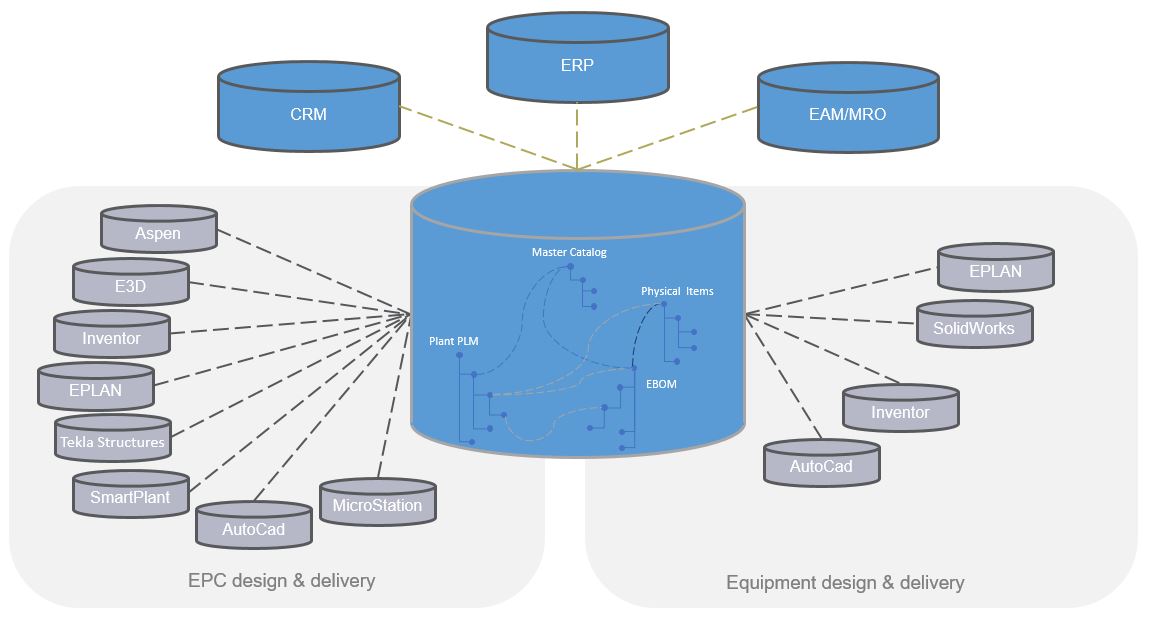
Traditionally it has looked much like this
Picture
Then let’s look at a definition of Big Data
​

“Big data is data sets that are so voluminous and complex that traditional data processing application software are inadequate to deal with them. Big data challenges include capturing data, data storage, data analysis, search, sharing, transfer, visualization, querying, updating and information privacy. There are three dimensions to big data known as Volume, Variety and Velocity.
Lately, the term "big data" tends to refer to the use of predictive analytics, user behavior analytics, or certain other advanced data analytics methods that extract value from data, and seldom to a particular size of data set. "There is little doubt that the quantities of data now available are indeed large, but that’s not the most relevant characteristic of this new data ecosystem." Analysis of data sets can find new correlations to "spot business trends, prevent diseases, combat crime and so on.”

Included in Big Data you’ll find data sets harvested from sensors within all sorts of equipment and products as well as data fed back from software running within products. One can say that a portion of Big Data is the resulting feedback from the Internet of Things. Data in itself is not of any value whatsoever, but if the data can be analyzed to reveal meaning, trends or knowledge about how a product is used by different customer segments then it has tremendous value to product manufacturers.
If we take a look at the operational phase of a product, and by that, I mean everything that happens from manufactured product to disposal, then any manufacturer would like to get their hands on such data, either to improve the product itself or sell services associated with it. Such services could be anything from utilizing the product as a platform for an ecosystem of connected products to new business models where the product itself is not the key but rather the service it provides. You might sell guaranteed uptime or availability provided that the customer also buys into your service program for instance.

 
The resulting analysis of the data should in my view be managed by, or at least serve as input to the product definition because the knowledge gleamed from all the analytics of Big Data sets ultimately impacts the product definition itself since it should lead to revised product designs that fulfills the customer needs better. It might also lead to the revelation that it would be better to split a product in two different designs going after two distinct end user behavior categories found as a result of data analysis from the operational phase of the products.
​
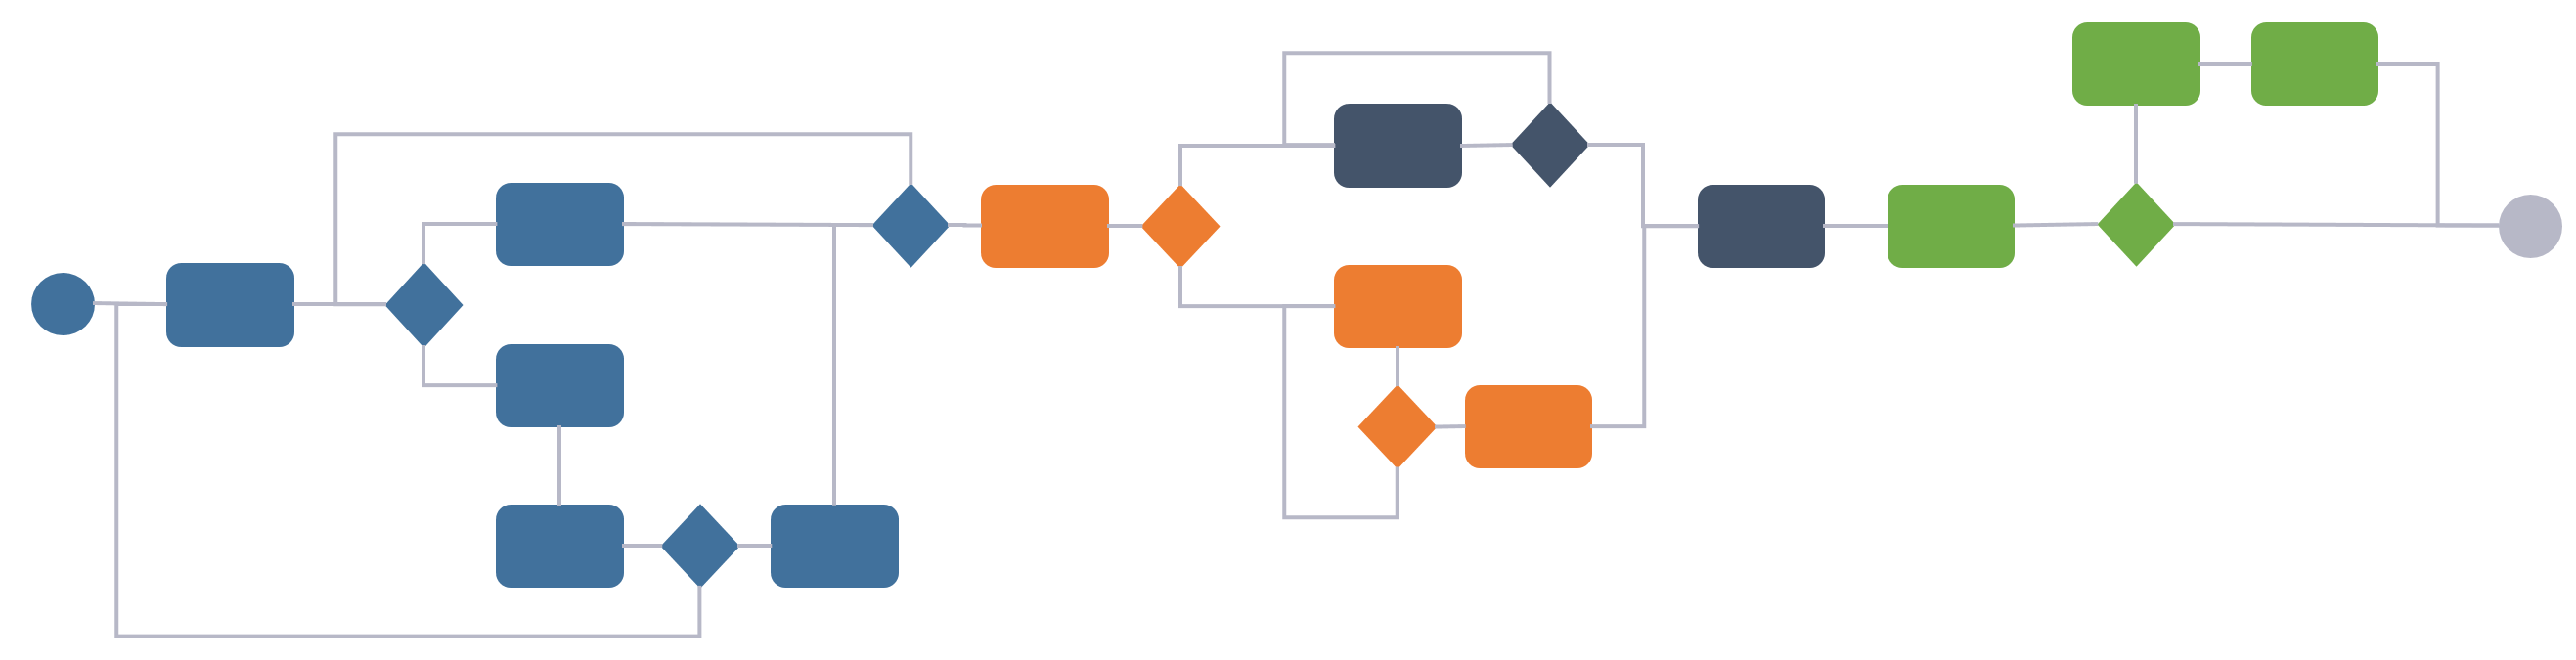
Connected products, Big Data and analysis will to a far greater extent than before allow us to do the following instead:
Picture
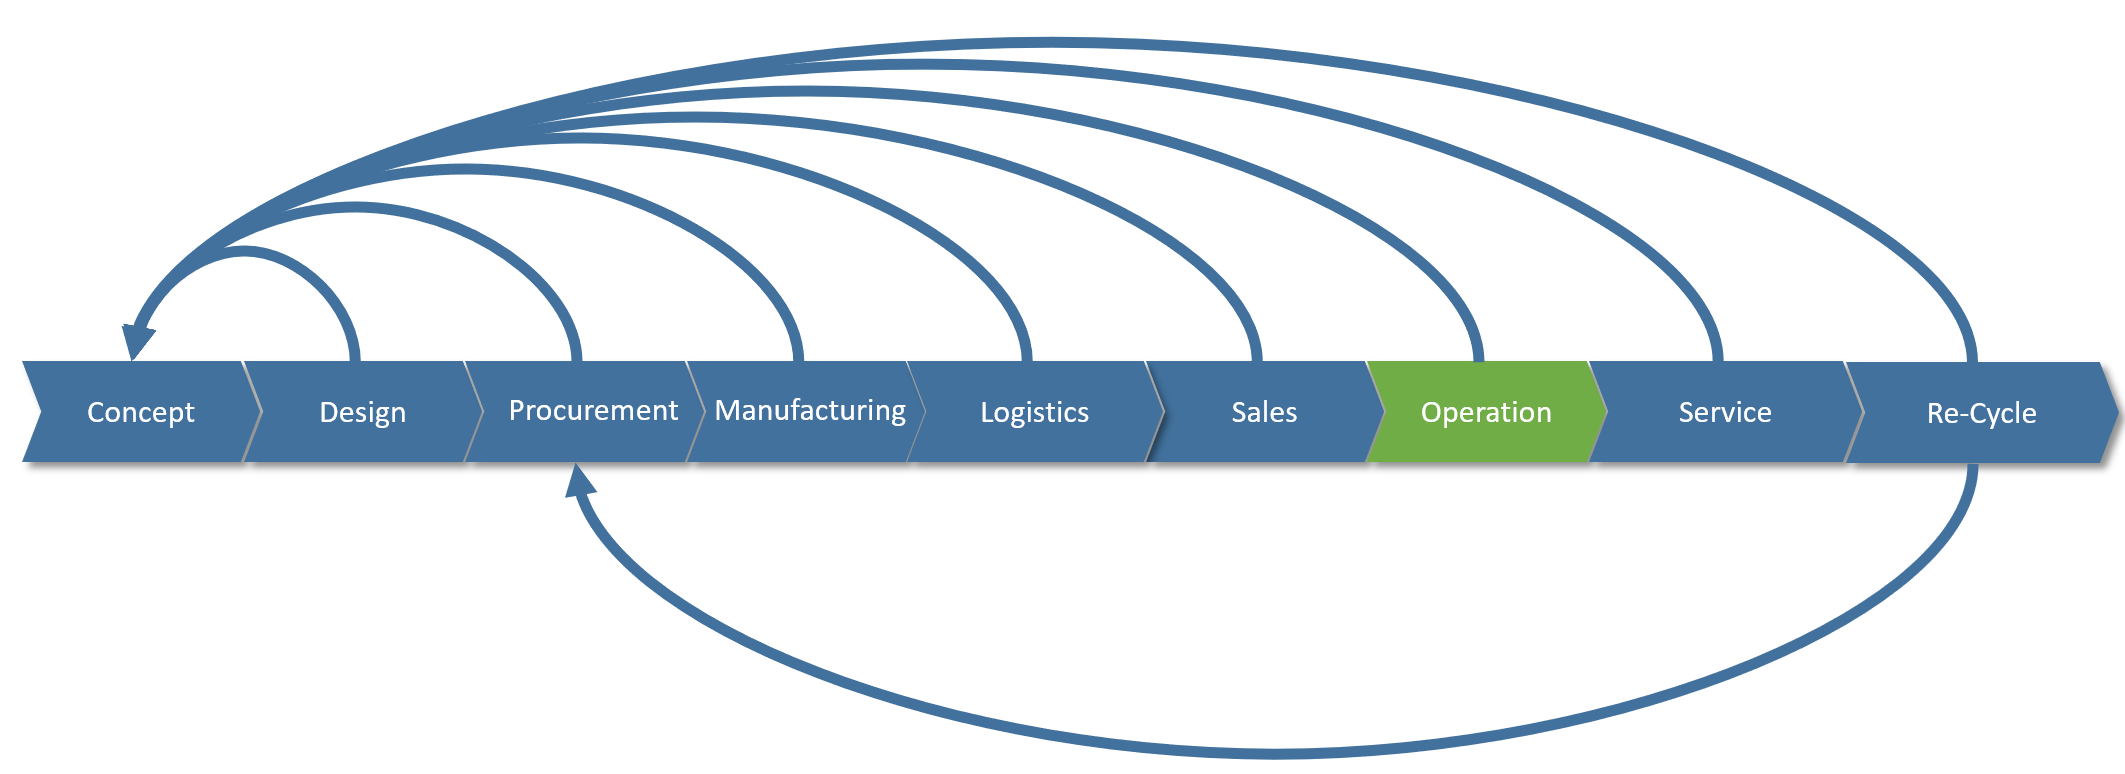
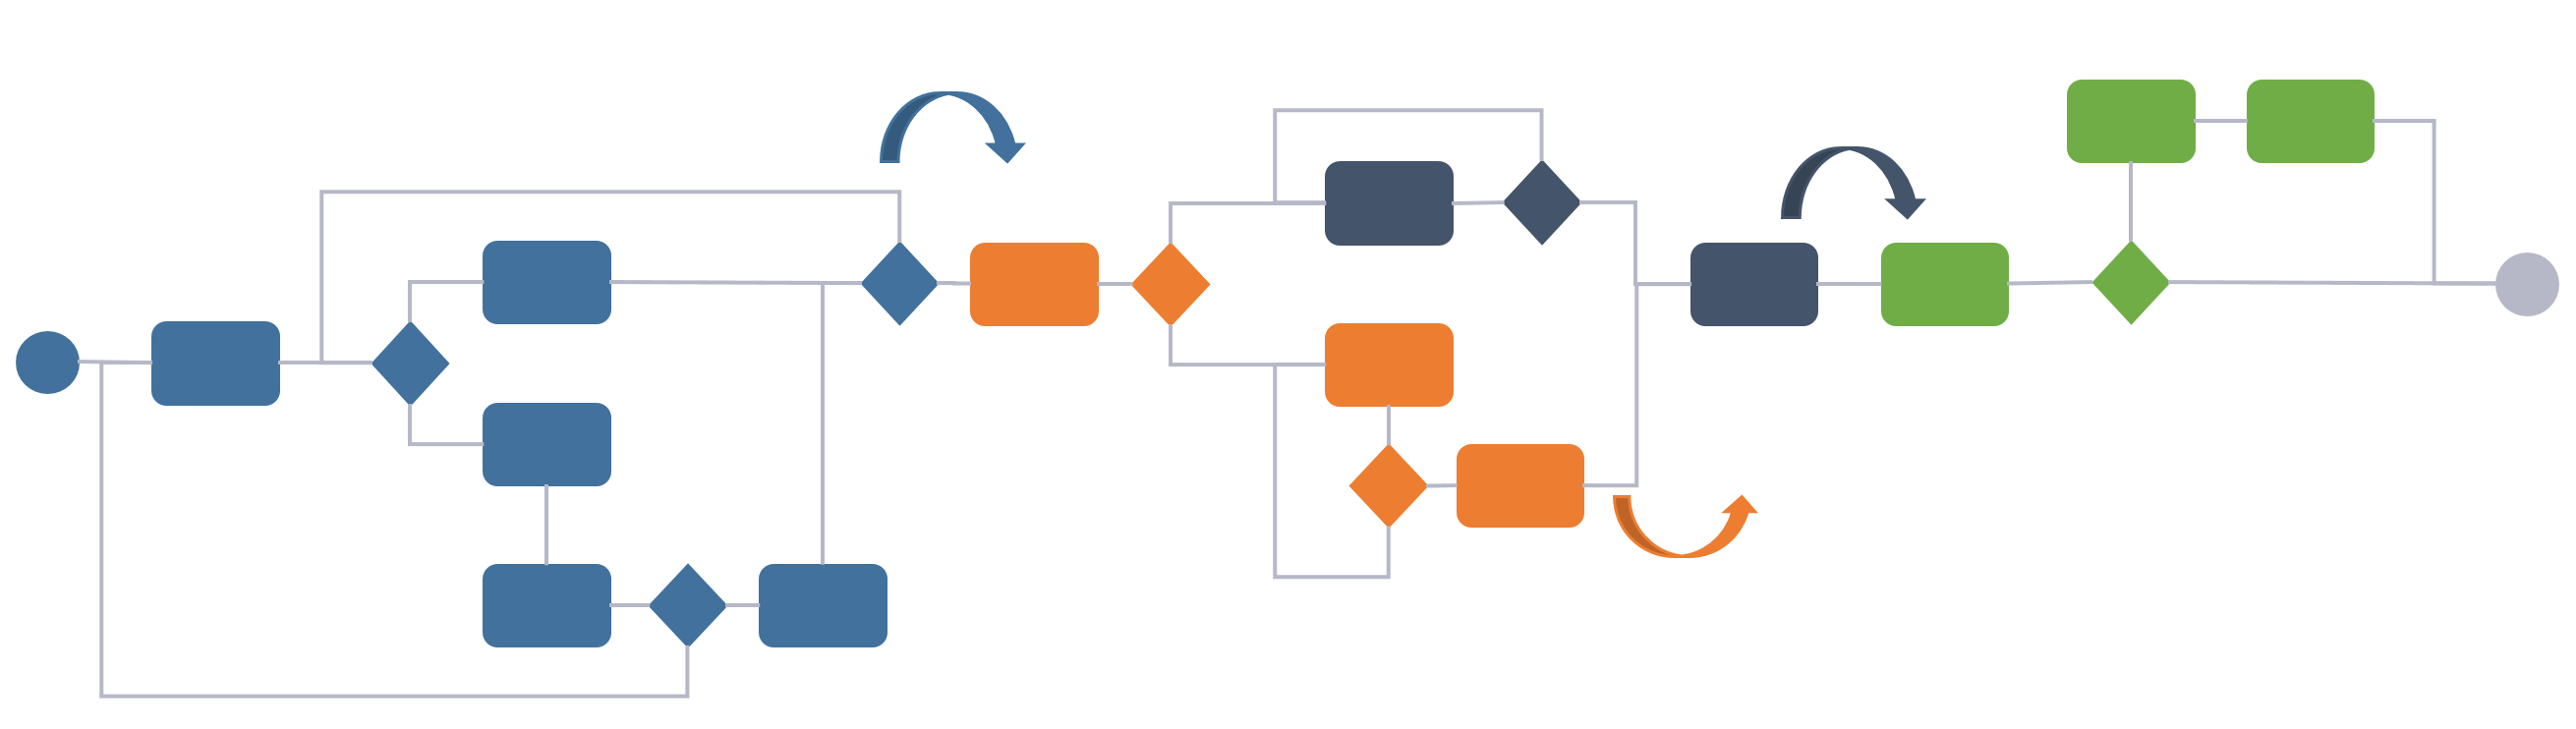
It will mean that experience throughout the full lifecycle can be made available to develop better products, tailor to new end user behavior trends and create new business models.

Note: the image above focuses on the feedback loops to product engineering, but such feedback loops should also be made available from for instance service and operation to manufacturing.

Most companies I work with tell me that the feedback loops described in the image above is either too poor, or virtually nonexistent. Furthermore, they all say that such feedback loops are becoming vital for their survival as more and more of their revenue comes from services after a product sale and not from the product sale itself. This means that it is imperative for them to have as much reliable and analyzed data as possible about their products performance in the field, how their customers are actually using them and how they are maintained.

For these companies at least, the connection between Big Data analysis and its impact on Product Lifecycle Management is becoming clearer and clearer.


Bjorn Fidjeland


The header image used in this post is by garrykillian and purchased at dreamstime.com

3 Comments

Digital Twin - What needs to be under the hood?

10/22/2017

0 Comments

 
Picture
In the article Plant Information Management – Information Structures, and the following posts regarding Plant Information Management (see Archive) I explained in more detail the various information structures, the importance of structuring the data as object structures with interconnecting relationships to create context between the different information sources. 

​What does all of this have to do with the digital twin? - Let's have a look.

Picture
​Information structures and their interconnecting relationships can be described by one of the major fashion word these days, the digital thread or digital twin.
The term and concept of a digital twin was first coined by Michael Grieves at the University of Michigan in 2002, but has since taken on a life of its own in different companies.
 
Below is an example of what information can be accessed from a digital twin or rather what the digital twin can serve as an entry point for:
Picture
​If your data is structured in such a way with connected objects, attributes and properties, an associated three-dimensional representation of the physically delivered instance is a tremendously valuable asset as a carrier of information. It is however, not a pre- requisite that it is a 3D model, a simple dashboard giving access to the individual physical items might be enough. The 3D stuff is always promoted in the glossy sales representations by various companies, but it’s not needed for every possible use case. In a plant or aircraft, it makes a lot of sense, since the volume of information and number of possible entry points to the full data set is staggering, but it might not be necessary to have individual three-dimensional representations for all mobile phones ever sold. It might suffice to have each data set associated with each serial number.
 
On the other hand, if you have a 3D representation, it can become a front end used by end users for finding, searching and analyzing all connected information from the data structures described in my previous blog posts. Such insights takes us to a whole new level of understanding of each delivered products life, their challenges and opportunities in different environments and the way they are actually being used by end customers.
 
Let’s say that we via the digital twin in the figure above select a pump. The tag of that pump uniquely identifies the functional location in the facility. An end user can pull information from the system the pump belongs to in the form of a parametric Piping & Instrumentation Diagram (P&ID), the functional specification for the pump in the designed system, information about the actually installed pump with serial number, manufacturing information, supplier, certificates, performed installation & commissioning procedures and actual operational data of the pump itself.
 
The real power in the operational phase becomes evident when operational data is associated with each delivered pump. In such a case the operational data can be compared with environmental conditions the physical equipment operates in. Let’s say that the fluid being pumped contains more and more sediments, and our historical records of similar conditions tells us that the pump will likely fail during the next ten days due to wear and tear of critical components. However, it is also indicated that if we reduce the power by 5 percent we will be able to operate the full system until the next scheduled maintenance window in 15 days. Information like that gives real business value in terms of increased uptime.
 
Let’s look at some other possibilities.
If we now consider a full facility with a three-dimensional representation:
During the EPC phase it is possible to associate the 3D model with a fourth dimension, time, turning it into a 4D model. By doing so, the model can be used to analyze and validate different installation execution plans, or monitor the actual ongoing installation of the Facility. We can actually see the individual parts of the model appearing as time progresses.
 
A fifth dimension can also be added, namely cost. Here the cost development over time according to one or several proposed installation execution plans or the actual installation itself can be analyzed or monitored.
This is already being done by some early movers in the construction industry where it is referred to as 5D or Virtual Design & Construction.
 
The model can also serve as an important asset when planning and coordinating space claims made by different disciplines during the design as well as during the actual installation. It can easily give visual feedback if there is a conflict between space claims made by electrical engineering and mechanical engineering, or if there is a conflict in the installation execution plan in terms of planned access by different working crews.
More and more companies are also making use of laser scanning in order to get an accurate 3D model of what has been actually installed so far. This model can easily be compared with the design model to see if there are any deviations. If deviations are found, they can be acted upon by analyzing how it will impact the overall system if it is left as it is, or will it require re-design? Does the decision to leave it as it is change the performance of the overall system? Are we still able to perform the rest of the installation, due to less available space?
Answers to these questions might entail that we will have to dismantle the parts of the system that has deviations. It is however a lot better and cost effective to identify such problems as early as possible.
 
This is just great, right? Such insights as mentioned would have huge impacts on how EPC’s manage their projects, operators run their plants and how product vendors can operate or service their equipment in the field, as well as feeding information back to engineering to make better products.
​
​New business models can be created in the likes of: “We sell power by the hour, dear customer, you don’t even have to buy the asset itself”!
(Power-by-the-Hour is a trademark of Rolls-Royce, although the concept itself is 50 years old you can read about a more recent development here)
 
So why haven’t more companies already done it?
 
Because in order to get there, the underlying data must be connected, and in the form of… yes data as in objects, attributes and relationships. It requires a massive shift from document orientation to connected data orientation to be at its most effective.
 
On the bright side, several companies in very diverse industries have started this journey, and some are already starting to harvest the fruits of their adventure.
​
My advice to any company thinking about doing the same would be along the lines of:
When eating this particular elephant, do it one bite at the time, remember to swallow and let your organization digest between each bite.

Bjorn Fidjeland

The header image used in this post is by Elnur and purchased at dreamstime.com

​
0 Comments

Who owns what data when…..?

7/7/2017

0 Comments

 
Picture
​A vital questions when looking at cross departmental process optimization and integration is in my view: who owns what data when in the overall process? 
Picture
Usually this question will spark up quite a discussion between the process owners, company departments, data owners and the different enterprise architects. The main reason for this is that depending on where the stakeholders have their main investment, they tend to look at “their” part of the process as the most important and the “master” for their data.

Just think about sales with their product configurators, engineering with CAD/PLM, supply chain, manufacturing & logistics with ERP and MES. Further along the lifecycle you encounter operations and service with EAM, Enterprise Asset Management, systems sometimes including MRO, Maintenance Repair and Operations/Overhaul. The last part being for products in operational use. Operations and service is really on the move right now due to the ability to receive valuable feedback from all products used in the field (commonly referred to as Internet of Things) even for consumer products, but hold your horses on the last one just for a little while.
​
The different departments and process owners will typically have claimed ownership of their particular parts of the process, making it look something like this:
Picture
This would typically be a traditional linear product engineering, manufacturing and distribution process. Each department has also selected IT tools that suit their particular needs in the process.
This in turn leads to information handovers both between company departments and IT tools, and due to the complexity of IT system integration, usually, as little as possible of data is handed from one system to the next.
​
So far it has been quite straight forward to answer “who owns what data”, especially for the data that is actually created in the departments own IT system, however, the tricky one is the when in “ who owns what data when”, because the when implies that ownership of certain data is transferred from one department and/or IT system to the next one in the process. In a traditional linear one, such information would be “hurled over the wall” like this:
Picture
Now, since as little information as possible flowed from one department / IT system to the next, each department would make it work as best as they could, and create or re-create information in their own system for everything that did not come directly through integration.
Only in cases where there were really big problems with lacking or clearly faulty data, an initiative would be launched to look at the process and any system integrations that would be affected.

The end result being that the accumulated information throughout the process that can be associated with the end product, that is to say the physical product sold to the consumer, is only a fraction of the actual sum of information generated in the different department’s processes and systems.
​
Now what happens when operations & services get more and more detailed information from each individual product in the field, and starts feeding that information back to the various departments and systems in the process?
Picture
The process will cease to be a linear one, it becomes circular with constant feedback of analyzed information flowing back to the different departments and IT systems.

Well what’s the problem you might ask.

The first thing that becomes clear is that each department with their systems does not have enough information to make effective use of all the information coming from operations, because they each have a quite limited set of data concerning mainly their discipline.

Secondly, the feedback loop is potentially constant or near real-time which will open up for completely new service offerings, however, the current process and infrastructure going from design through engineering and manufacturing was never built to tackle this kind of speed and agility.

Ironically, from a Product Lifecycle Management perspective, we’ve been talking about breaking down information and departmental silos in companies to utilize the L in PLM for as long as I can remember, however the way it looks now, it is probably going to be operations and the enablement of Internet Of Things and Big Data analytics that will force companies to go from strictly linear to circular processes.

And when you ultimately do, please always ask yourself “who should own what data when”, because ownership of data is not synonymous with the creation of data. Ownership is transferred along the process and accumulates to a full data set of the physically manufactured product until it is handed back again as a result of fault in the product or possible optimization opportunities for the product.

 – And it will happen faster and faster
​
Bjorn Fidjeland


The header image used in this post is by Bacho12345 and purchased at dreamstime.com
0 Comments

Digitalization - sure, but on what foundation?

4/7/2017

5 Comments

 
Picture
The last couple of years I’ve been working with some companies on digitalization projects and strategies. Digitalization is of course very attractive in a number of industries:

  • Equipment manufacturers, where digitalization can be merged with Internet Of Things to create completely new service offerings and relationships with the customers
  • Capital projects EPC’s and operators, where a digital representation of the delivery can be handed over as a “digital twin” to the operator , and where the operator can use it and hook it up to EAM or MRO solutions to monitor the physical asset real-time in a virtual world. The real value for the operator here is increased up-time and lower operational costs, whereas EPC’s can offer new kinds of services and in addition mitigate project risks better.
  • Construction industry, where the use of VDC (Virtual Design & Construction) technology can be extended to help the facility owner minimize operational costs and optimize comfort for tenants by connecting all kinds of sensors in a modern building and adjust accordingly.
But hang on a second: If we look at the definition of digitalization, at least the way Gartner views it

“Digitalization is the use of digital technologies to change a business model and provide new revenue and value-producing opportunities; it is the process of moving to a digital business.” (Source: Gartner)

…The process of moving to a digital business….

The digitalization strategies of most of the companies I’ve been working with focuses on the creation of new services and revenue possibilities on the service side of the lifecycle of a product or facility, so AFTER the product has been delivered, or the plant is in operation.
There is nothing wrong with that, but if the process from design through engineering and manufacturing is not fully digitalised (by that I do not mean documents in digital format, but data as information structures linked together) then it becomes very difficult to capitalize on the promises of the digitalization strategy.
​
Consider 2 examples
Picture
Figure 1.
​
Figure 1 describes a scenario where design and engineering tools work more or less independently and where the result is consolidated in documents or excel before communicated to ERP. This is the extreme scenario to illustrate the point, and most companies have some sort of PDM/PLM or Engineering Register to perform at least partial consolidation of data before sending to ERP. However I often find some design or engineering tools operating as “islands” outside the consolidation layer.

So if we switch viewpoint to the new digital service offering promoted to end customers. What happens when a sensor is reporting back a fault in the delivered product? The service organization must know exactly what has been delivered, where the nearest spare parts are, how the product  is calibrated etc. to quickly fix the problem with a minimum use of resources in order to make a profit and to exceed customer expectation to gain a good reputation.
​
How likely is that to happen with the setup in figure 1?

​
Picture
Figure 2.
​
The setup in figure 2 describes a situation where design and engineering information is consolidated together with information regarding the actually delivered physical products. This approach does not necessarily dictate that the information is only available in one and only one software platform, however the essence is that the data must be structured and consolidated.

Again let’s switch viewpoint to the new digital service offering promoted to end customers. What happens when a sensor is reporting back a fault in the delivered product?
When data is available as structured and linked data it is instantly available to the service organization, and appropriate measures can be taken while informing the customer with accurate data.
​
My clear recommendation is that if you are embarking on a digitalization journey to enhance your service offering and offer new service models, then make sure you have a solid digital foundation to build those offerings on. Because if you don’t it will be very difficult to achieve the margins you are dreaming of.
​
Bjorn Fidjeland


The header image used in this post is by kurhan and purchased at dreamstime.com
5 Comments

From digital archive to intelligent data

6/7/2015

1 Comment

 
Picture
A lot of companies these days are working hard to turn their big digital archives into more intelligent data. These initiatives usually comes from some kind of digitalization strategy that has been formed to support a vision.

We see it every day, data is power, data can be analyzed, used in different contexts to support end customers, to sell new services or support internal processes in the company. 

Picture
However, for this to happen it is not enough so simply store and manage data in digital format. The data must be “connected”, stored in object or information structures that represents the data used in different contexts. Coming from a PLM background, some of the aspects are quite easy to identify. From a product perspective you’ve got a requirements breakdown structure, maybe a model configuration or variant structure, an engineering bill of material that represents the design intent and supporting CAD structures from various design tools. All of the structures mentioned are being managed today as digital information, but very few companies have structured the information and put it all in context of the other information structures to achieve full traceability and change consequence control.

Note, I’ve so far only touched the product design aspect, so when considering the manufacturing intent (the manufacturing bill of material), the manufactured product, the sold product and the installed product the complexity grows, but so does the benefits of managing it all as connected data structures stored in context of each other. This data can be used to sell services to the end customers.

Examples could be a pump manufacturer who has full traceability on all pumps sold to different facilities. The pump manufacturer could offer services for maintenance of the pumps, and if the pump contains different sensors, the manufacturer could also analyze operational data to schedule preventive maintenance. This data could then serve as valuable input to the design processes of new and even better pumps. As a consequence of the fact that all data structures are connected, the pump manufacturer knows the location of all pumps sold, and can offer the new and improved model not only to all customers, but to all customers and all the locations for each customer.

All of a sudden we are touching one of the biggest fashion words these days “the Internet Of Things”, because what would happen if a large portion of the pumps were installed on ships and they contained sensors? The pump manufacturer could set up maintenance offices in large ports. Knowing exactly what pumps would arrive in what ports, at what times and what maintenance need they have would allow the manufacturer or service provider to order the right spare parts just in time and to reduce the maintenance time. This would minimize the risk of fines by the ship owners because the ship had to stay in port longer than scheduled or even worse, having the service personnel performing the service at sea and thereby leaving the service office in the port severely under manned.

This is only one example of the power of “connected data” or digitalization. Quite a few companies have similar business models as our pump manufacturer, but very few have the opportunity to utilize the services by “connected data”. Instead there are a lot of manual work, interpretation and searching for data in different digital archives. This in turn leads to errors, misunderstandings and lost business opportunities.

 Some points to ponder

Bjorn Fidjeland


All images used in this post are purchased at dreamstime.com

1 Comment

    plmPartner

    This is where we share our thoughts, ideas and experiences with you

    RSS Feed

    View my profile on LinkedIn

    Categories

    All
    AEC
    BIM
    Data Management
    Digital Twin
    ERP
    Facility Lifecycle Management
    Integration
    Internet Of Things
    IOT
    Platform
    PLM
    Process
    Product Lifecycle Management
    Strategy
    Structured Data
    Technical Information Management
    VDC
    Virtual Design And Construction

Contact us:
plmPartner AS    Lyngfjellveien 14    4580 Lyngdal    Norway    +47 99 03 05 19    info@plmpartner.com