
All facility owners want a facility that produces 24/7, 365 days a year, however, nobody has it.
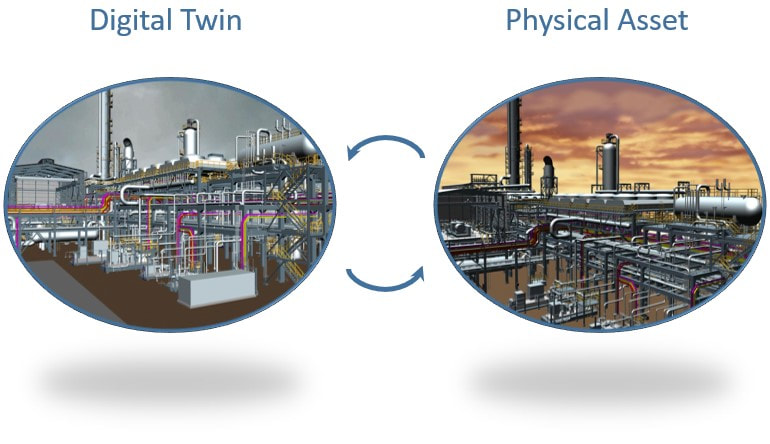
Production needs to be halted for all sorts of reasons both scheduled, like planned maintenance, and un-scheduled, like interventions due to failures in critical equipment. The digital twin promises that if you have an exact data-based replica of your physical facility which actually “talks to” and “understands” your physical facility, you will be able to greatly optimize operations, maintenance, risk management, safety etc.
How?
Well, if data is acquired real-time from sensors on equipment in the operating facility and fed to the digital twin for analysis towards the design and engineering specifications of both the equipment itself and the facility system in which it operates, then one can learn really interesting stuff: Is the equipment operating within the thresholds set by the system design? Is the equipment nearing its end of useful life, is it behaving oddly, do we have historical knowledge to predict what happens when the equipment behaves like this? Can we reduce throughput and expect to reach the next scheduled maintenance window before it breaks, thereby limiting production downtime?
This sort of things, that can facilitate pro-active actions and predictive maintenance instead of re-active and corrective maintenance and thereby increasing the operational time.
In addition, if you do have such a data-based up to date replica of the facility, it becomes a lot easier to simulate and test everything from hazardous operations, to regular work with Lock-Out Tag-Out procedures, installation planning and execution of new equipment, inspection routes etc. because you can train for it in the virtual world of the digital replica. Of course, this is only true if the digital replica is kept up to date……..
So how can we go about actually getting such a digital replica of our facility?
There are essentially two ways to get there:
Facility owners can start specifying that a digital replica of the facility is a part of the EPC (I-C) contract, and that this delivery is just as important as the actual physical facility.
I have seen some facility owners moving in this direction; however, they then have to specify exactly what constitutes a successful digital replica delivery, and then make sure that it is updated continuously during operations.
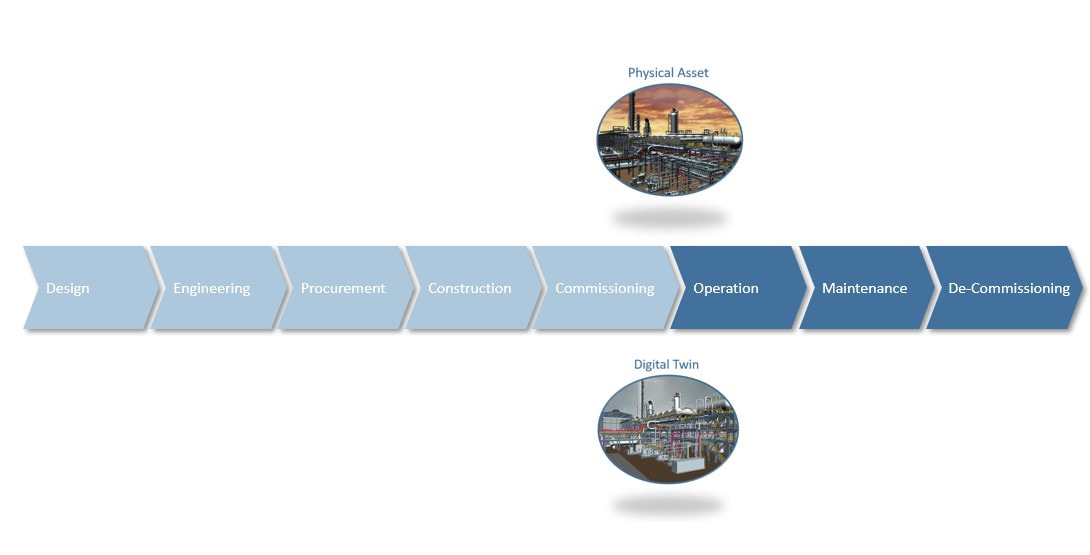
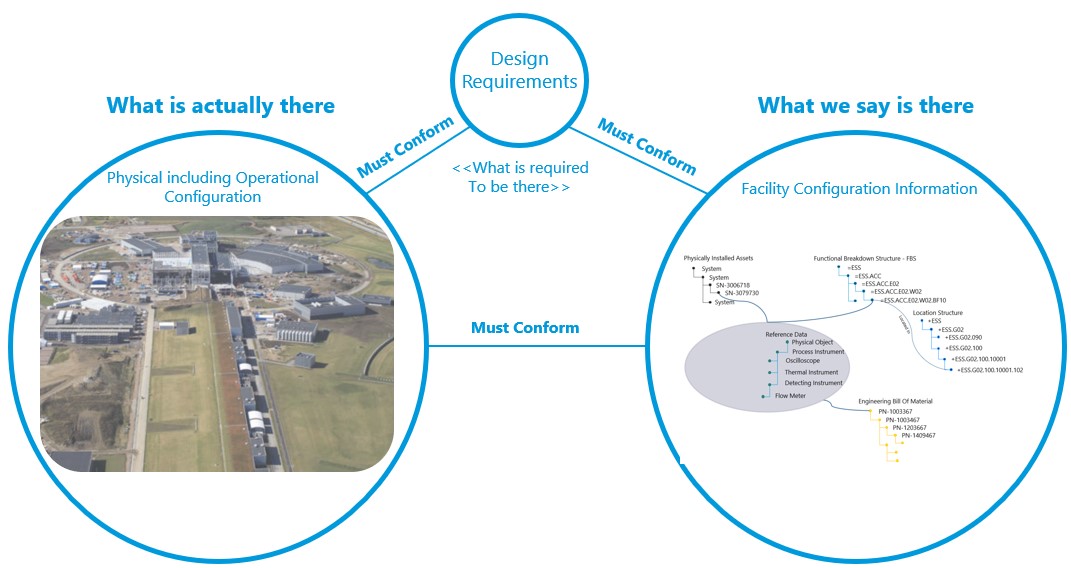
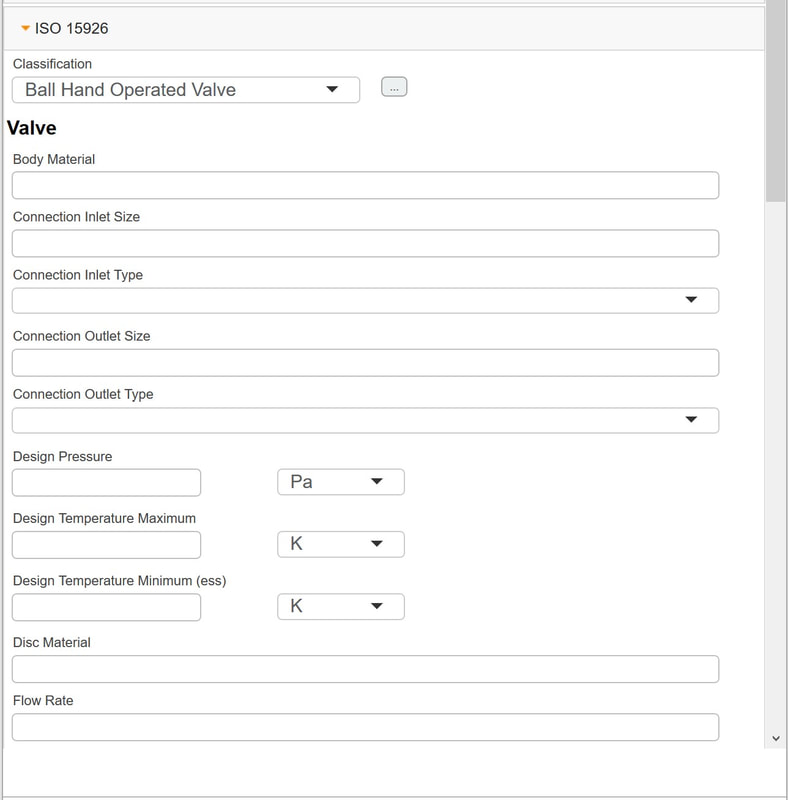
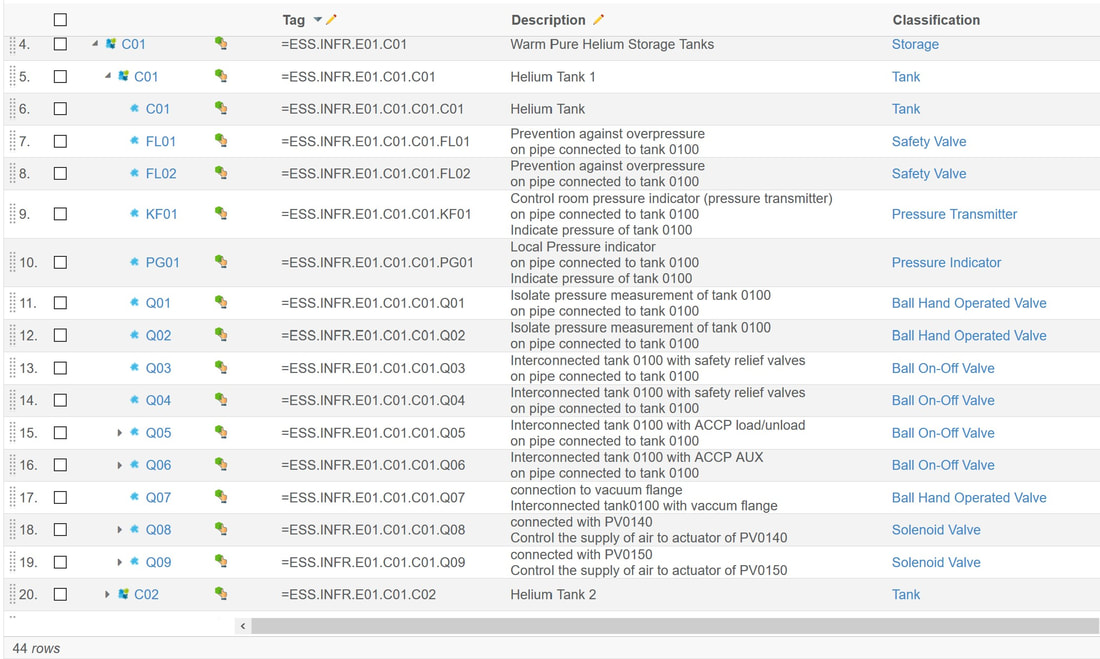
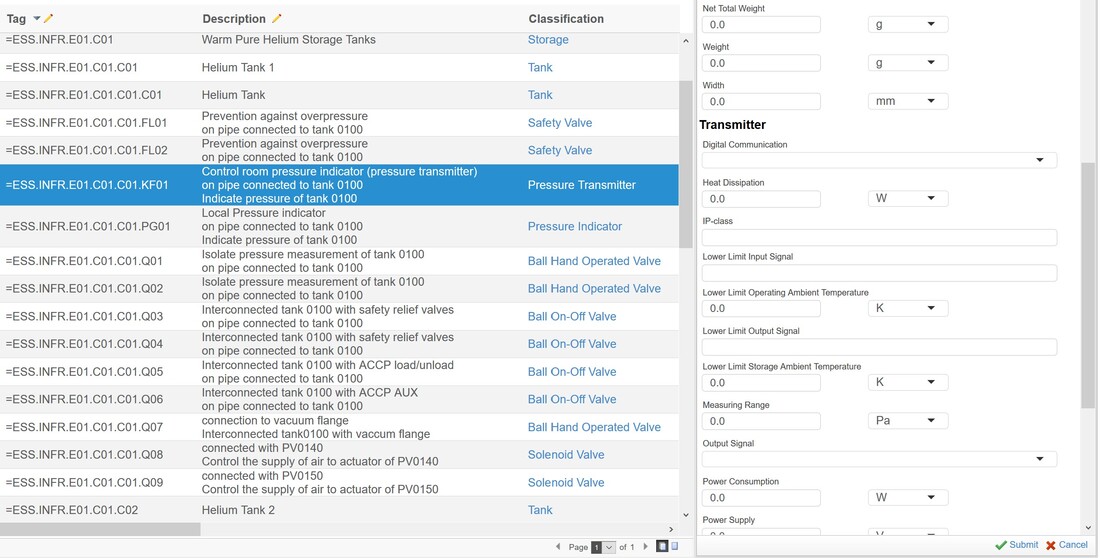
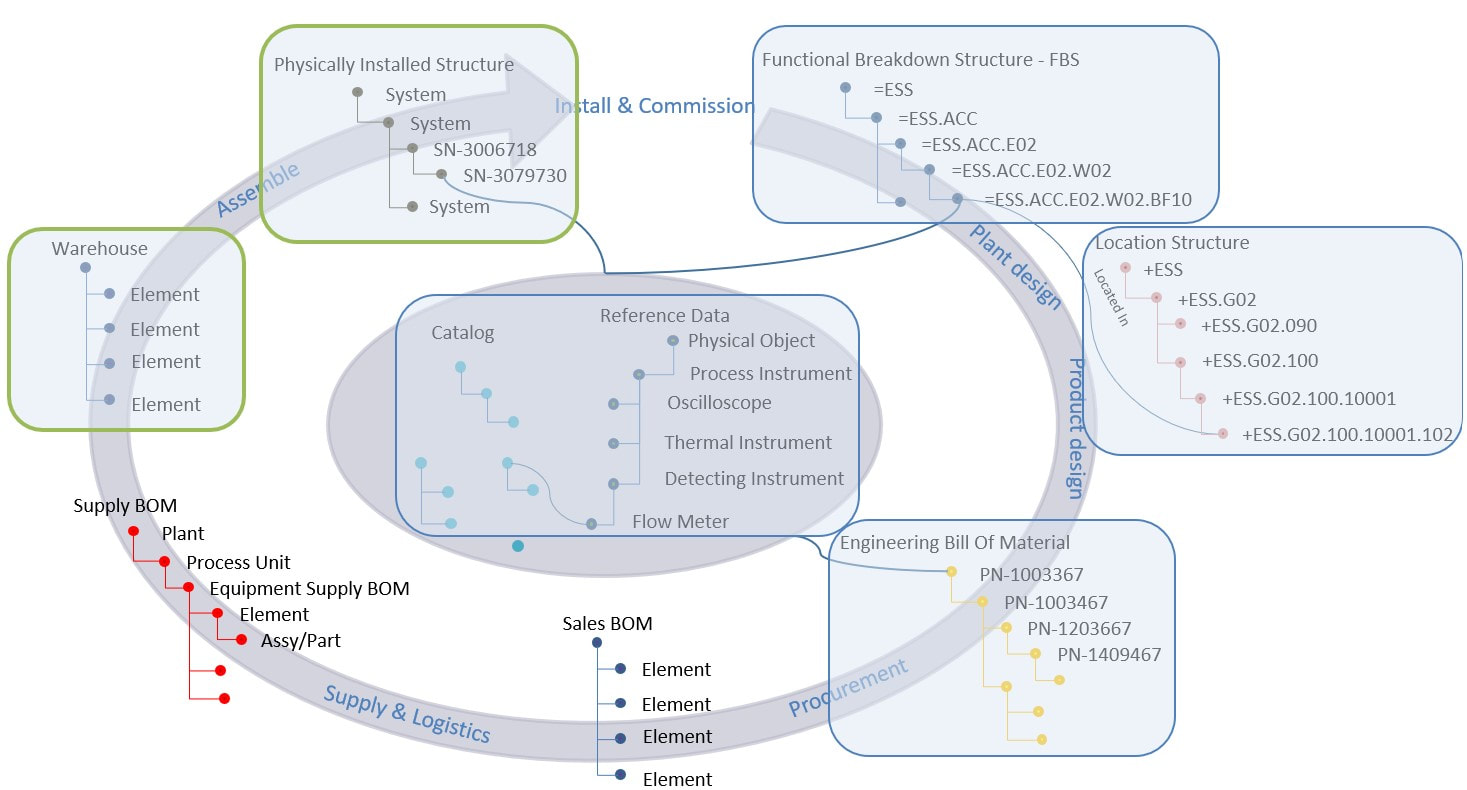
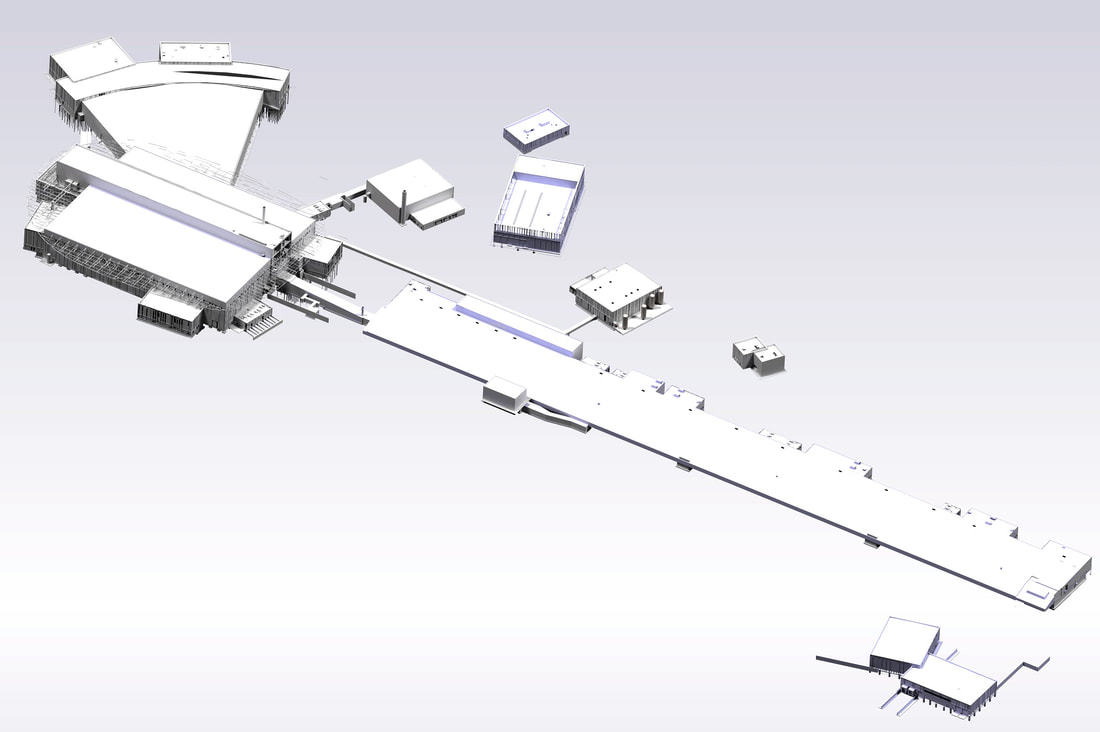
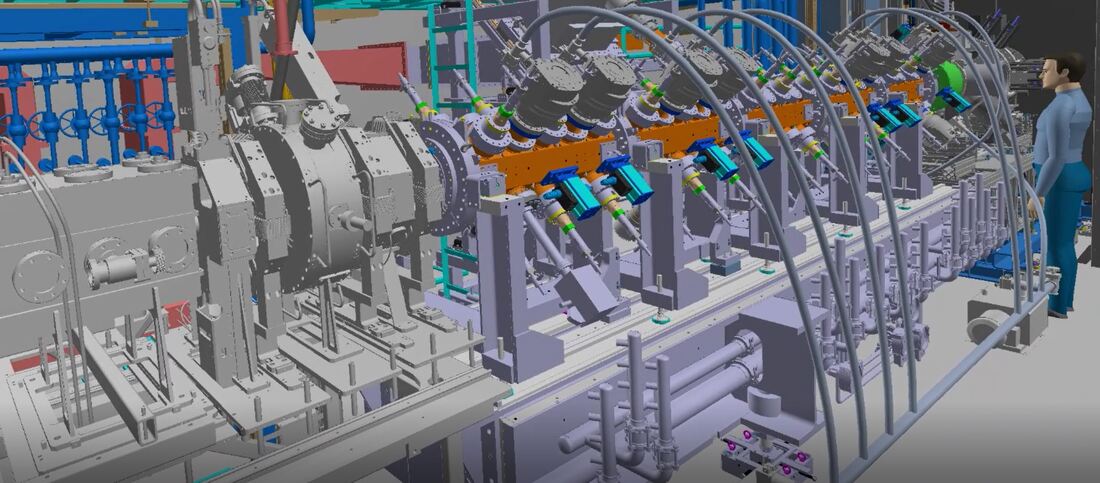
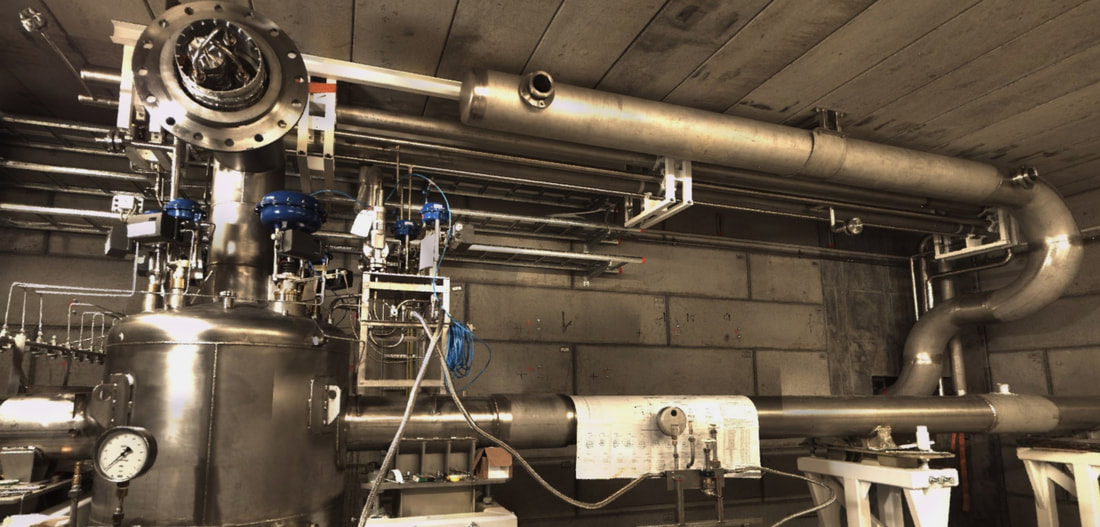
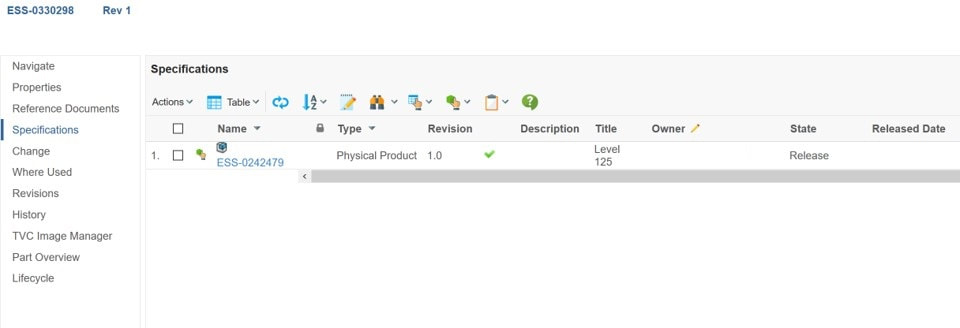
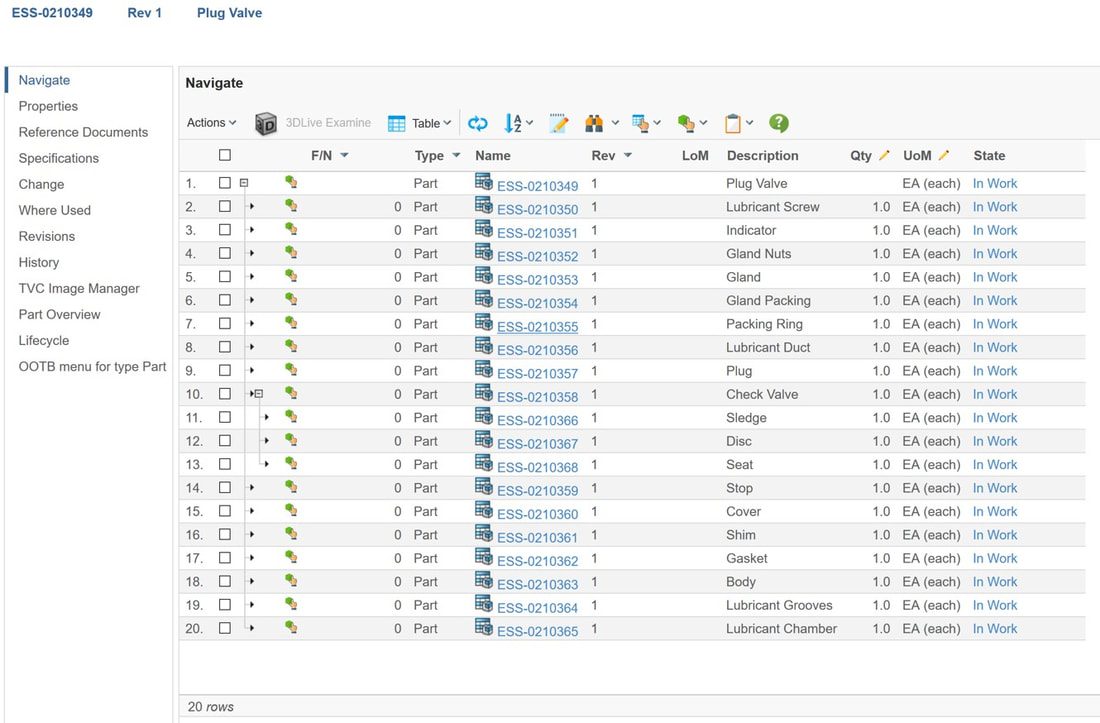
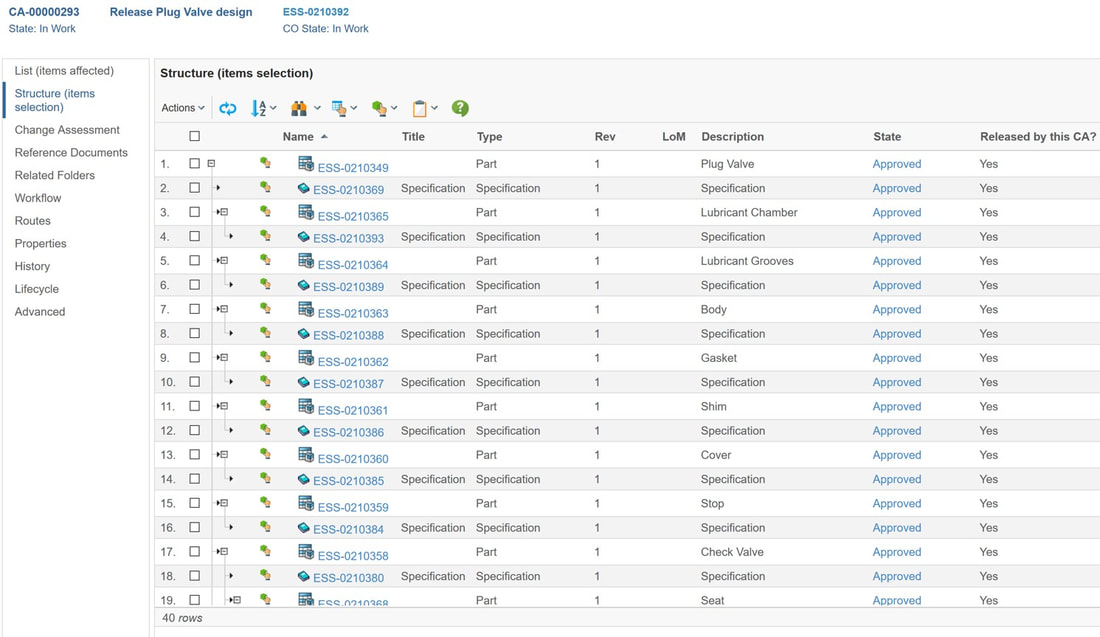
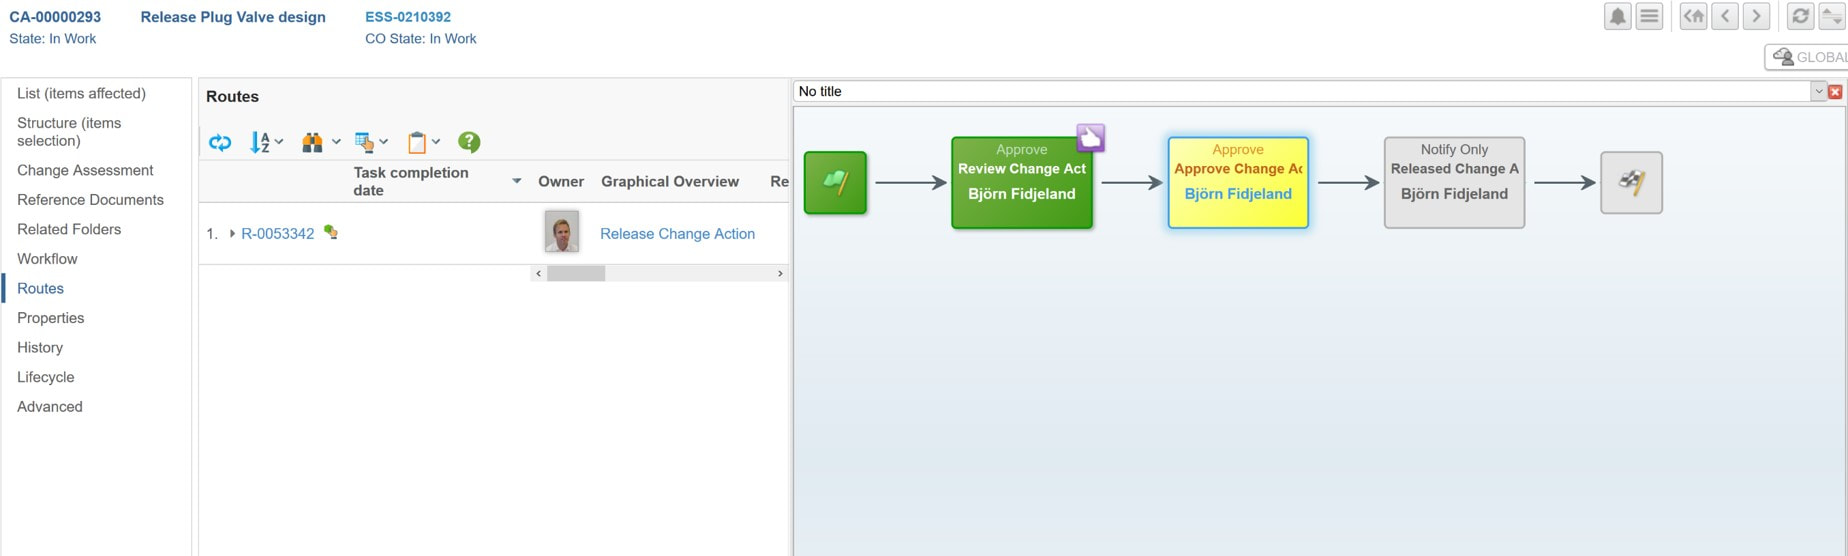
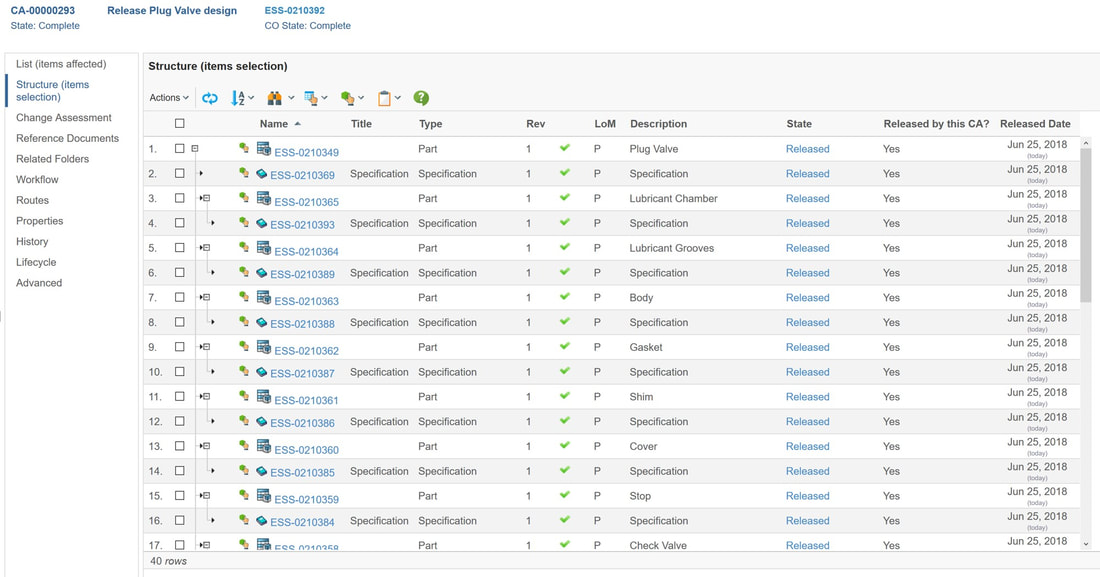
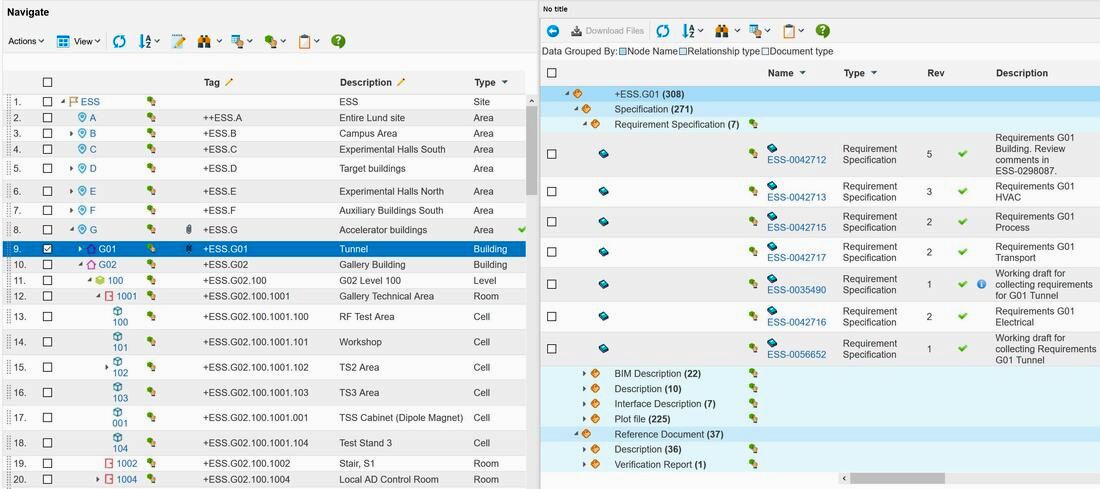
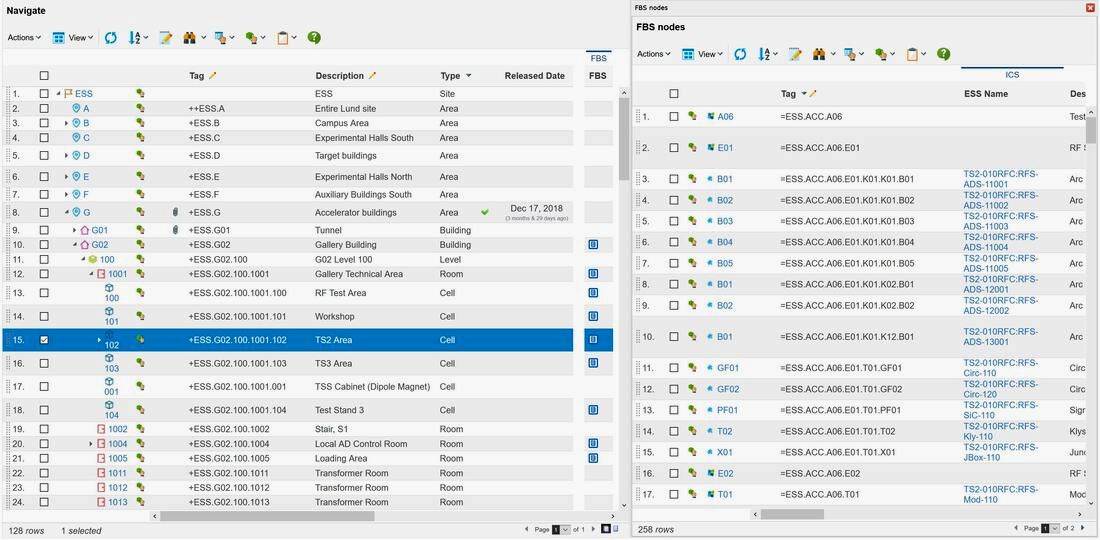
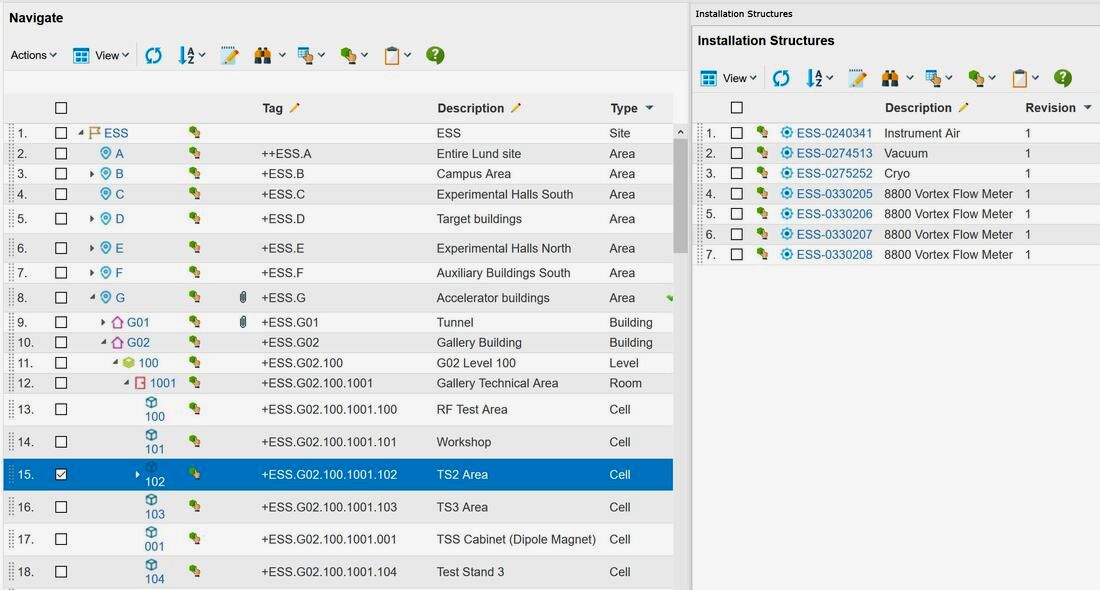
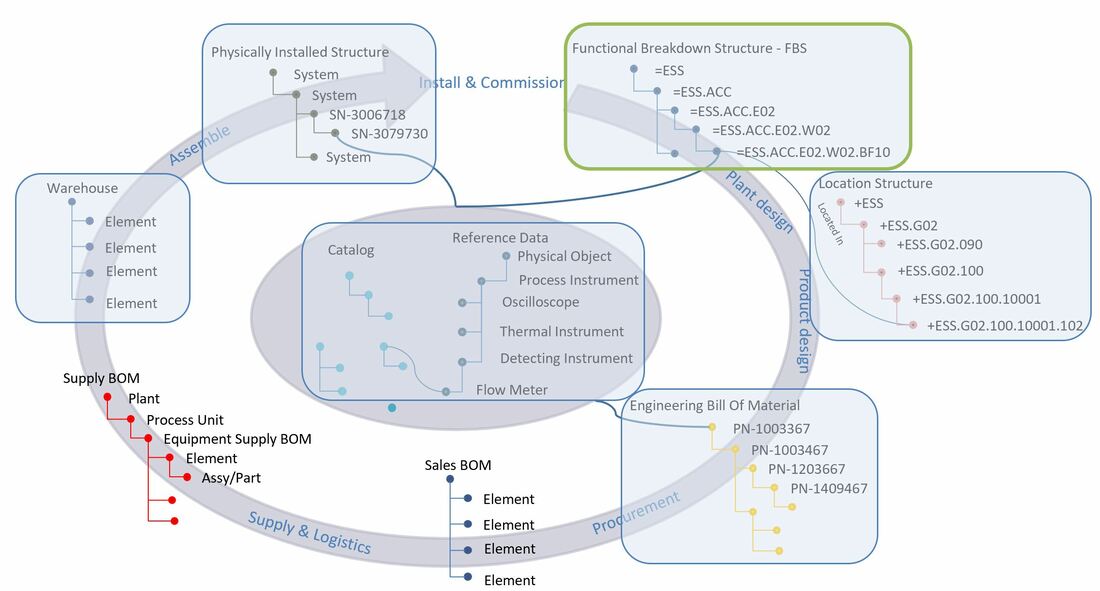
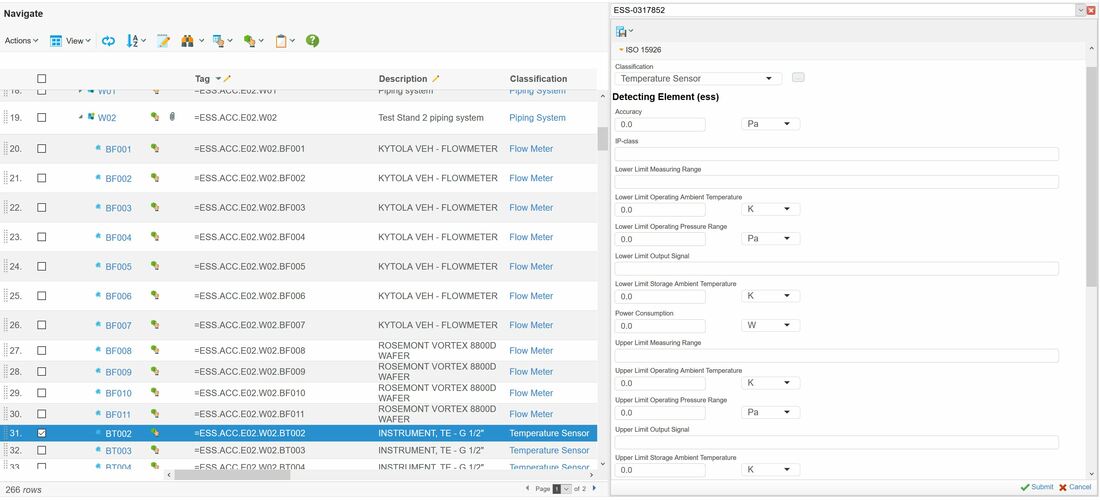
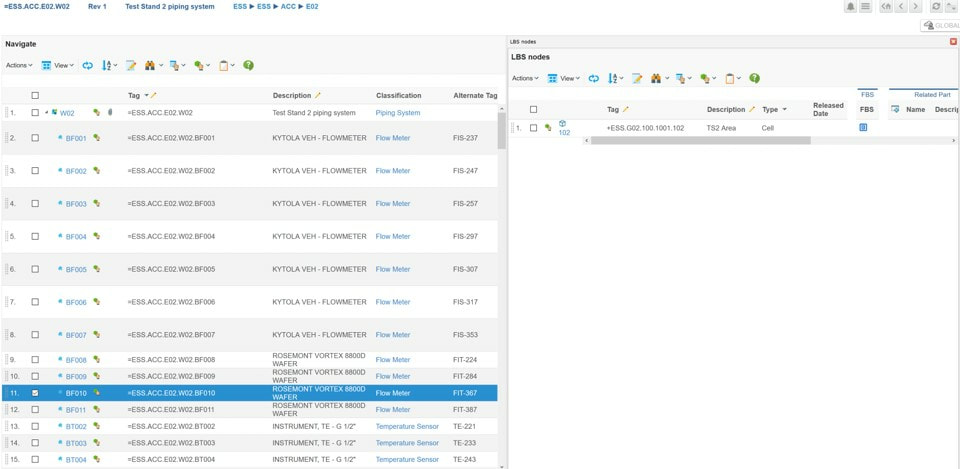
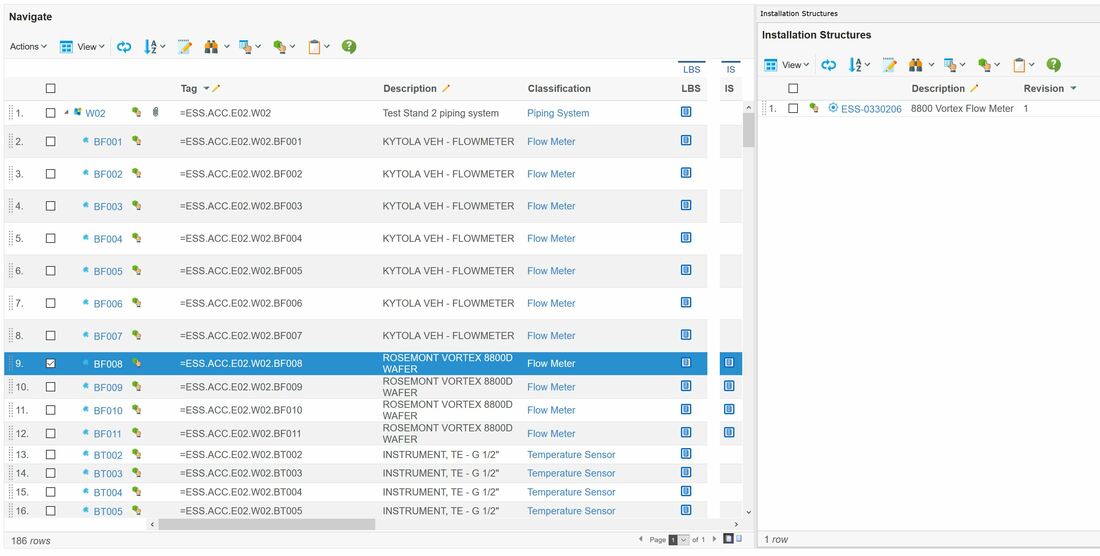
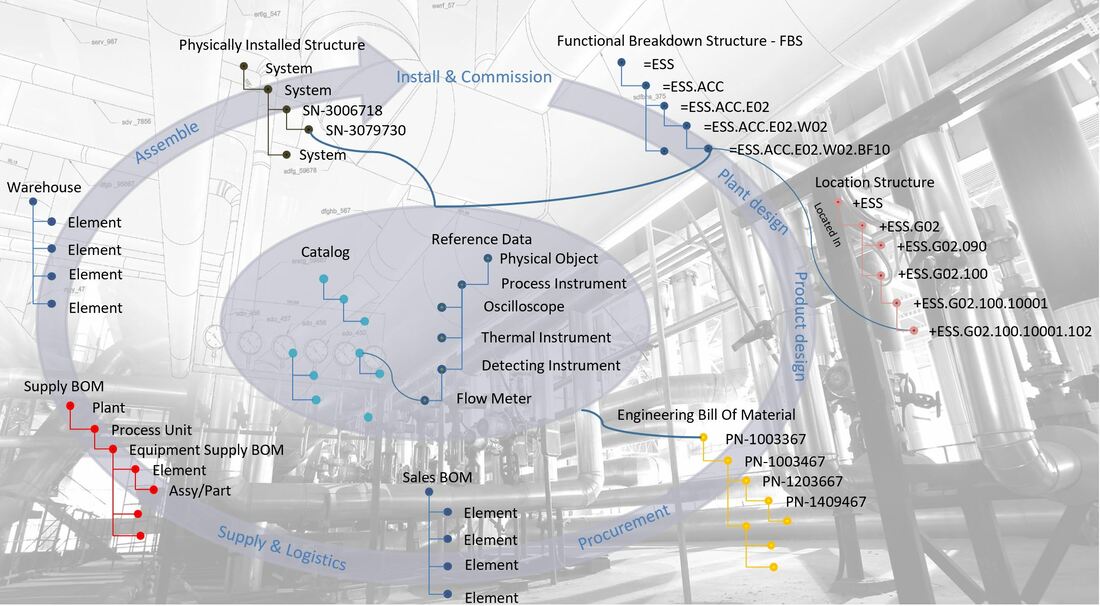
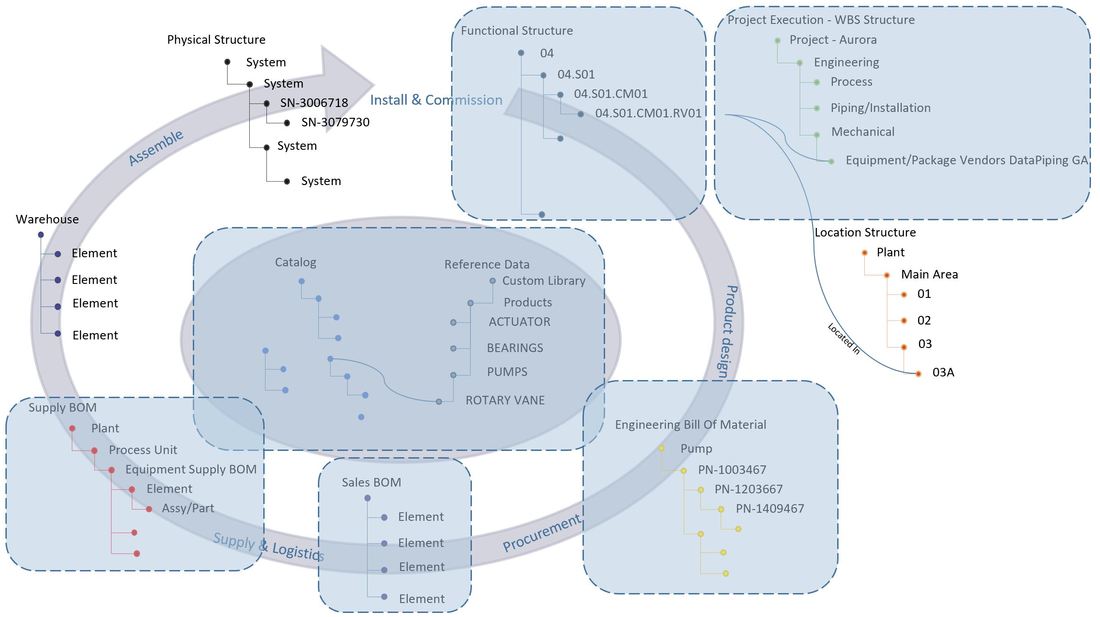
Figure 1: "Digital Twin" created by EPC and handed over as part of commissioning
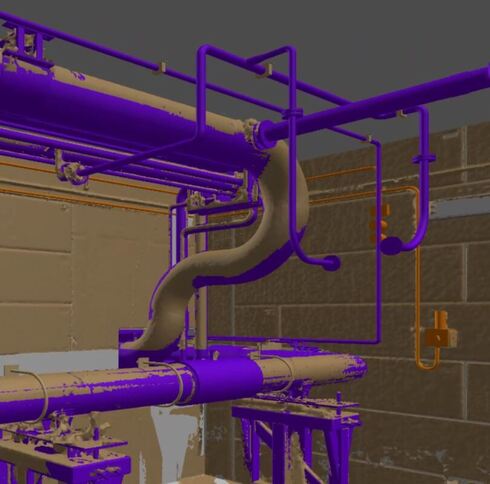
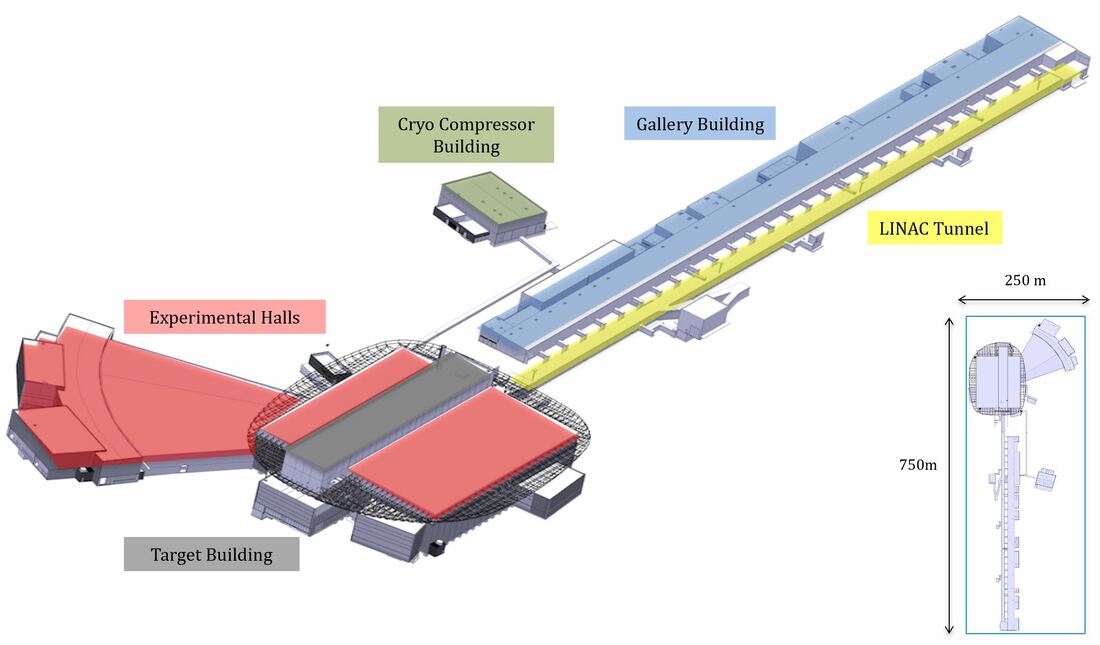
Or, if the facility is already built and operational, laser scans can be performed to gain an As-Operated model of the facility. However, this will only give you a pretty model. Data about initial design requirements, installed assets and their design, data from installation and commissioning, and what has happened to the equipment and systems since then must be reverse engineered and connected to achieve a digital twin fit for purpose.
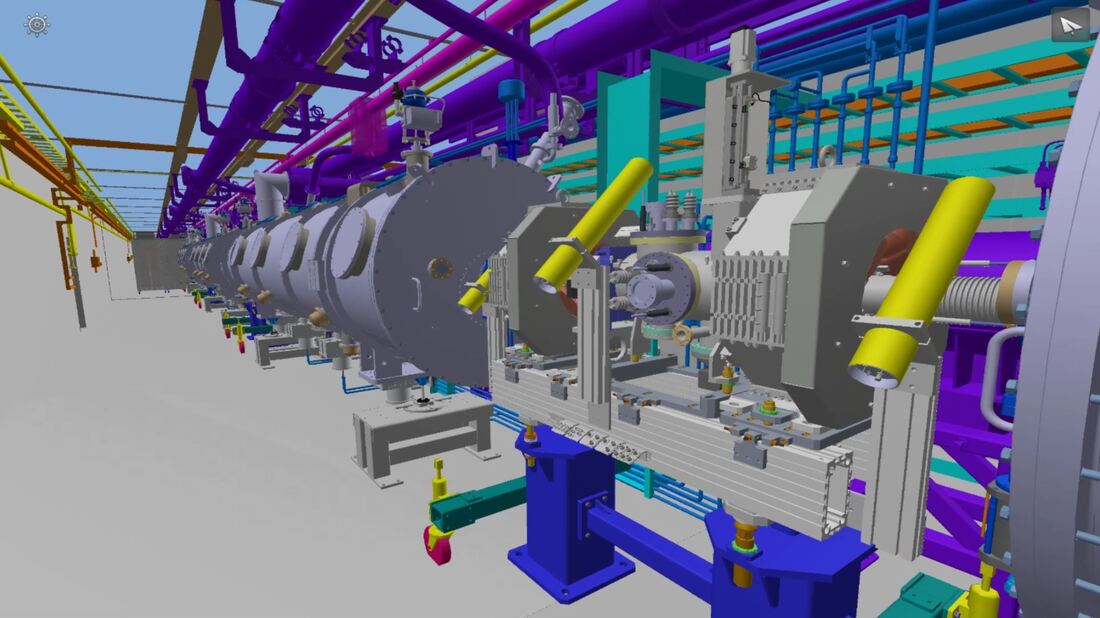
Or, if the facility is already built and operational, laser scans can be performed to gain an As-Operated model of the facility. However, this will only give you a pretty model. Data about initial design requirements, installed assets and their design, data from installation and commissioning, and what has happened to the equipment and systems since then must be reverse engineered and connected to achieve a digital twin fit for purpose.
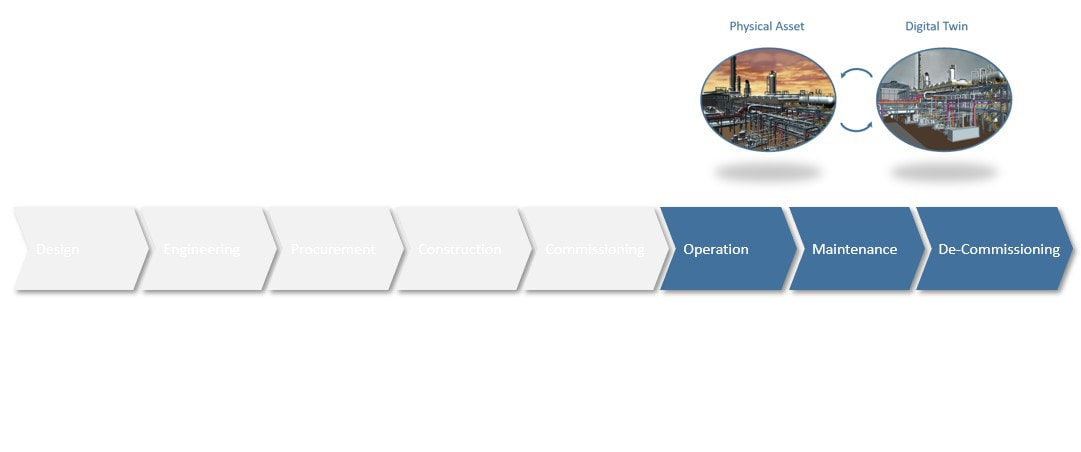
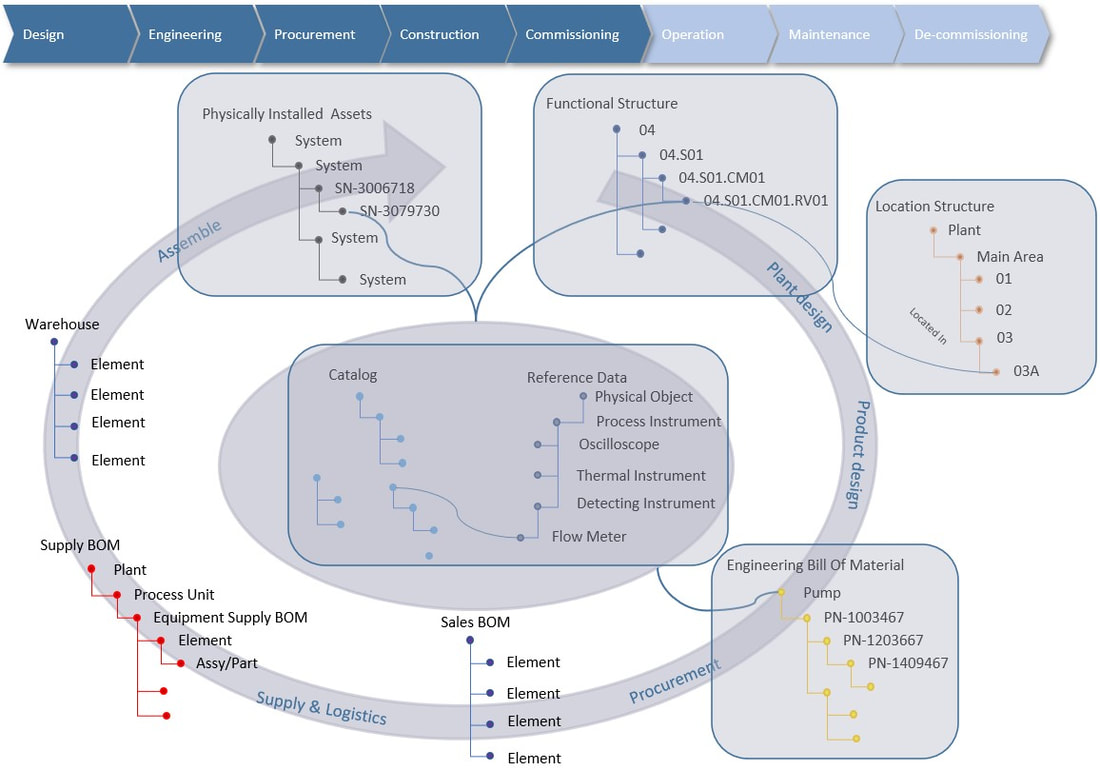
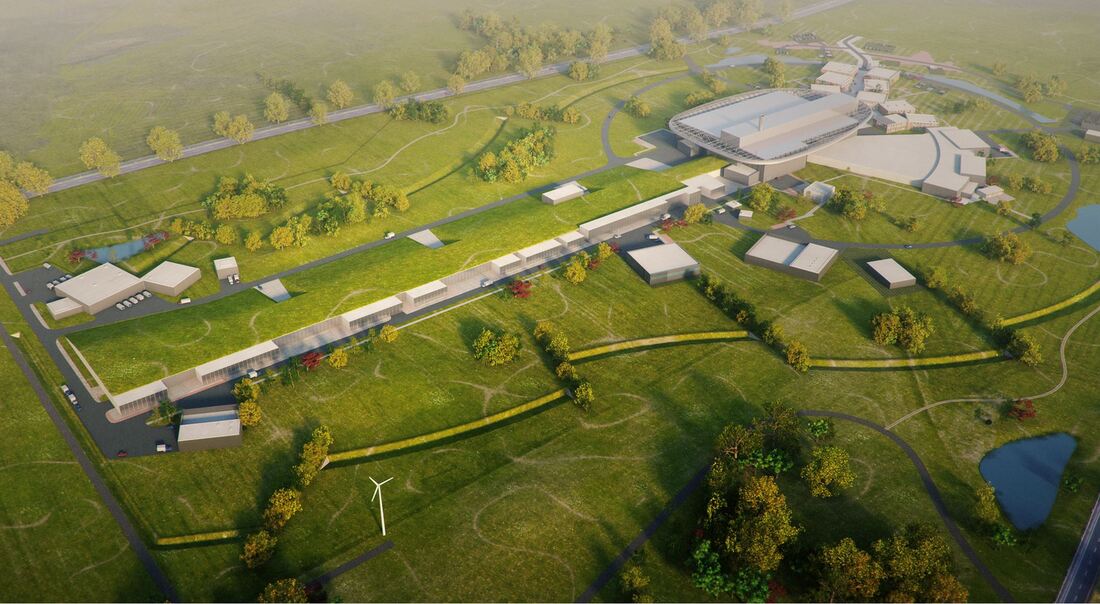
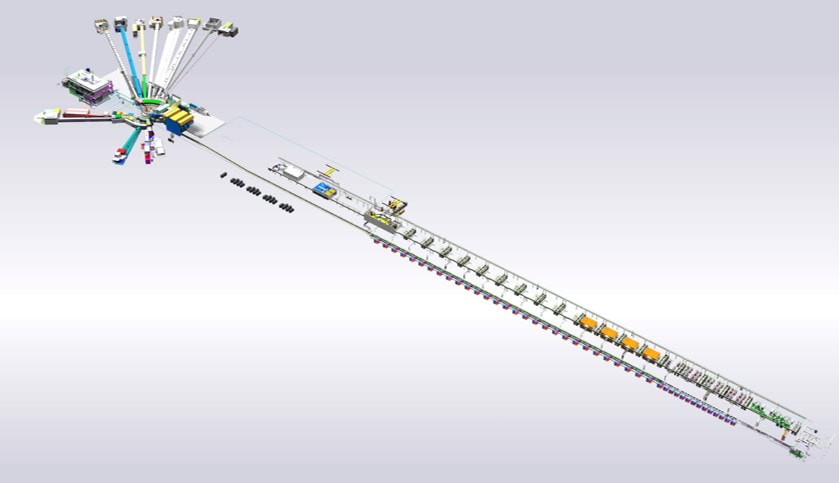
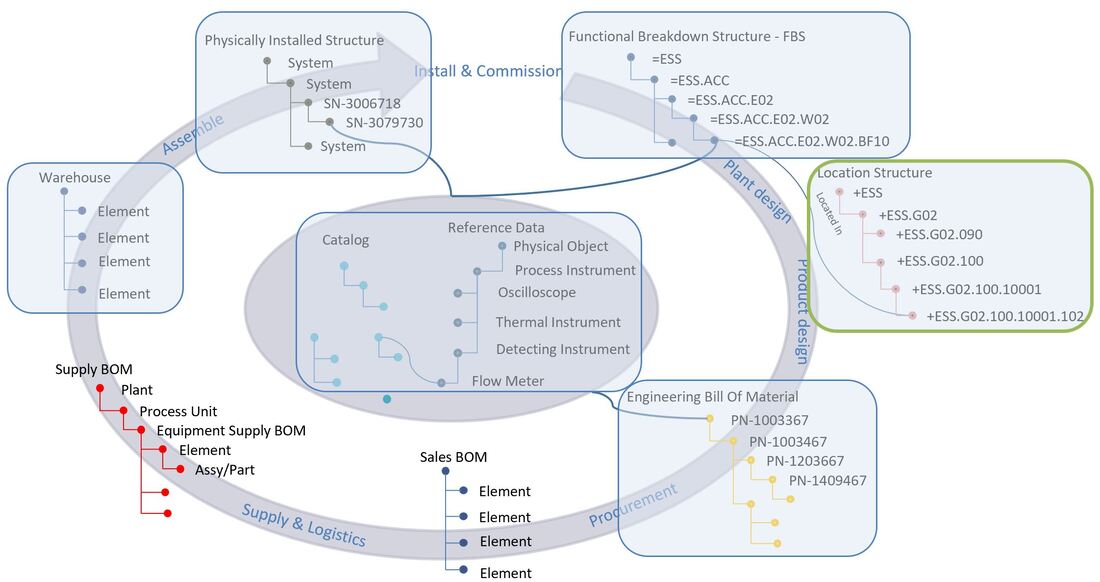
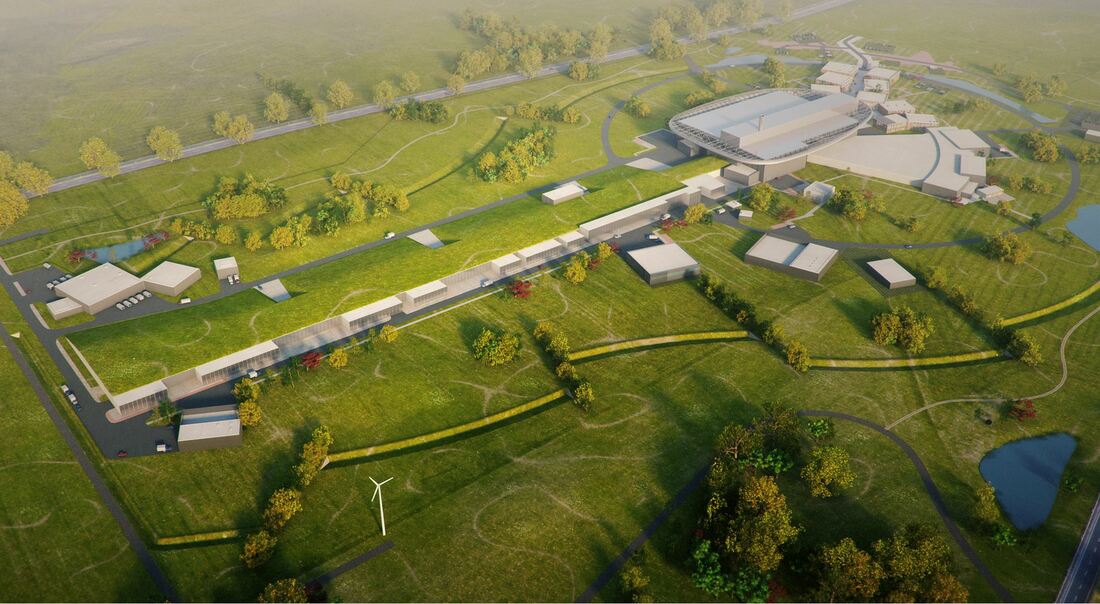
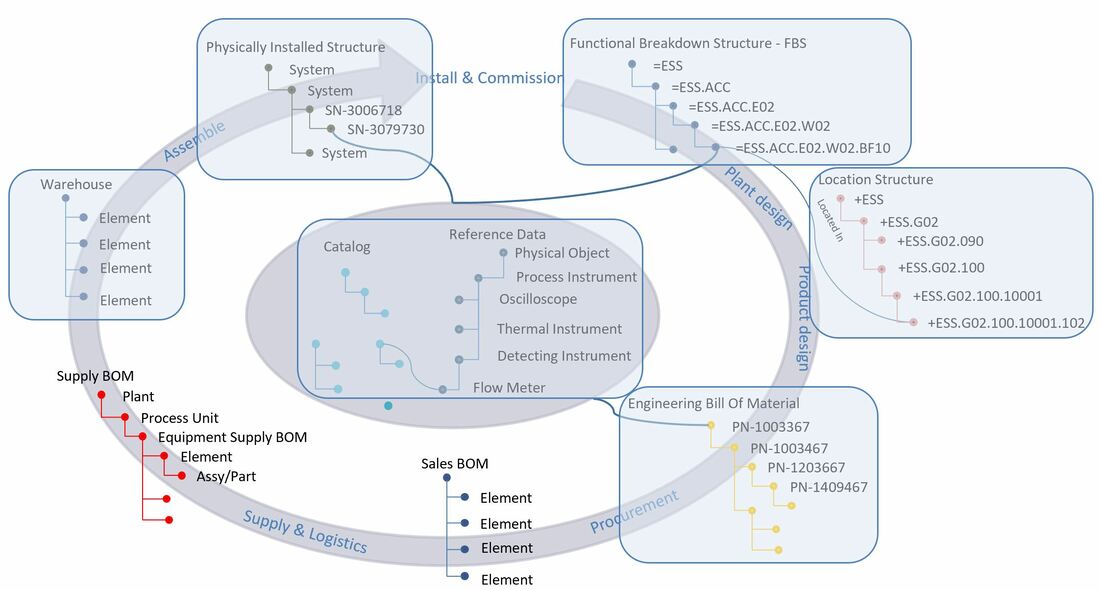
Figure 2: "Digital Twin" created during operations by laser scanning and reverse engineering
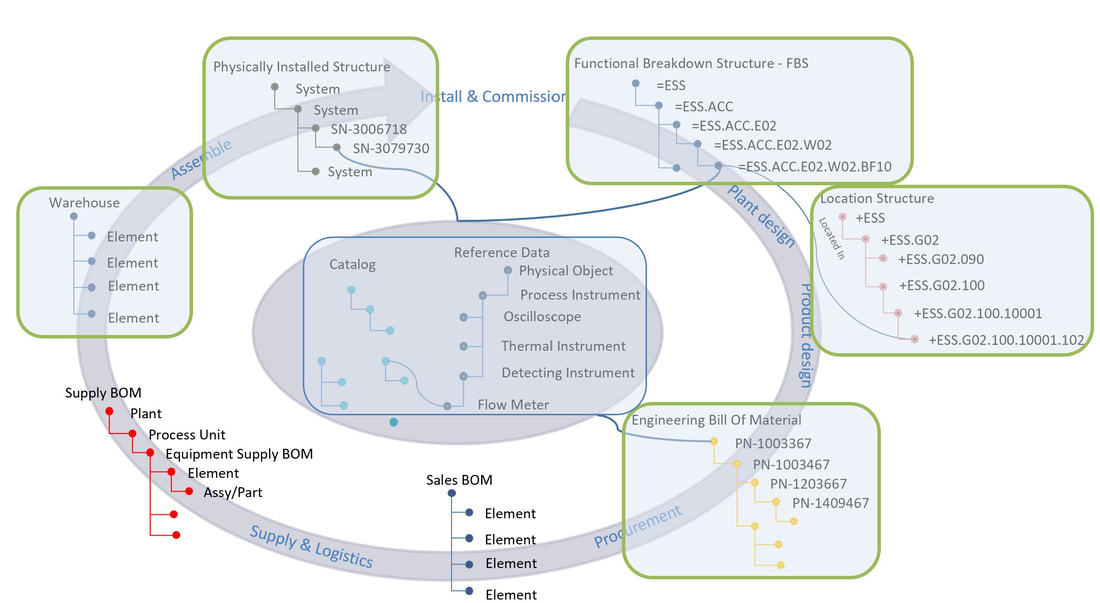
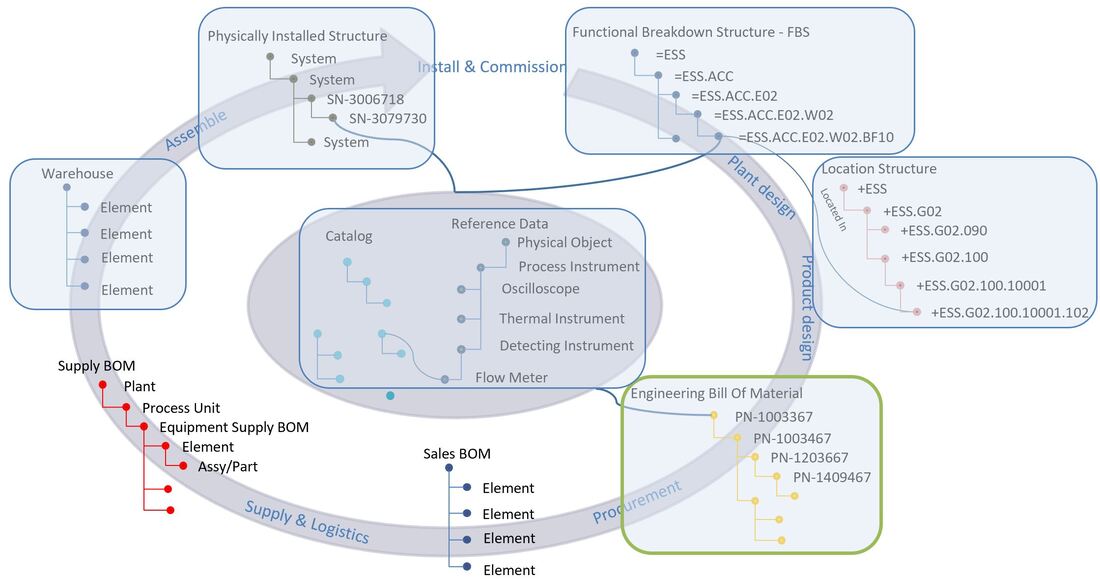
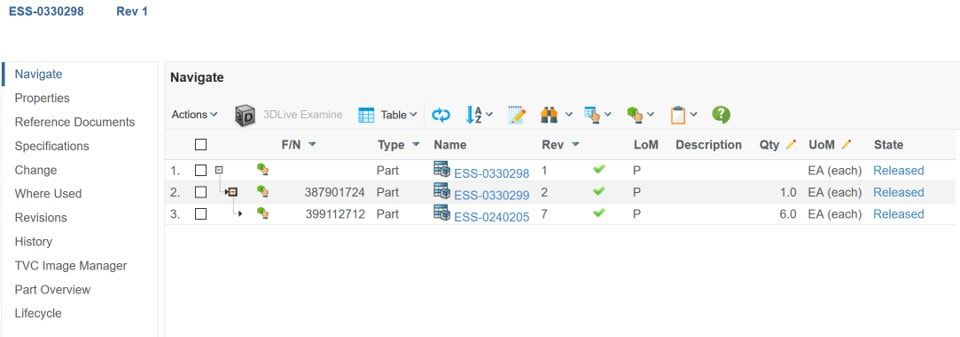
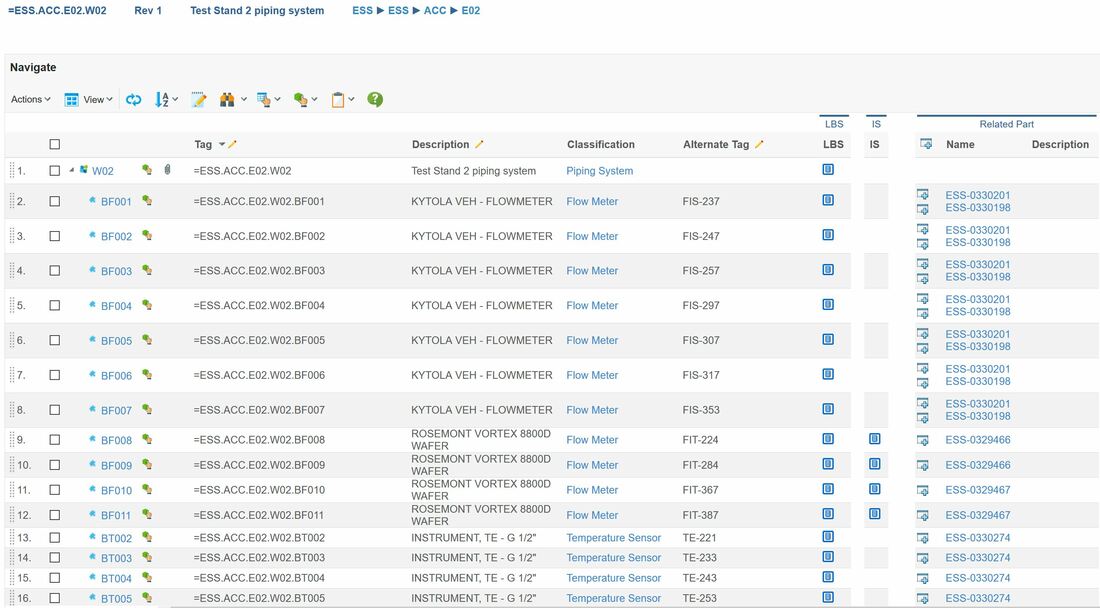
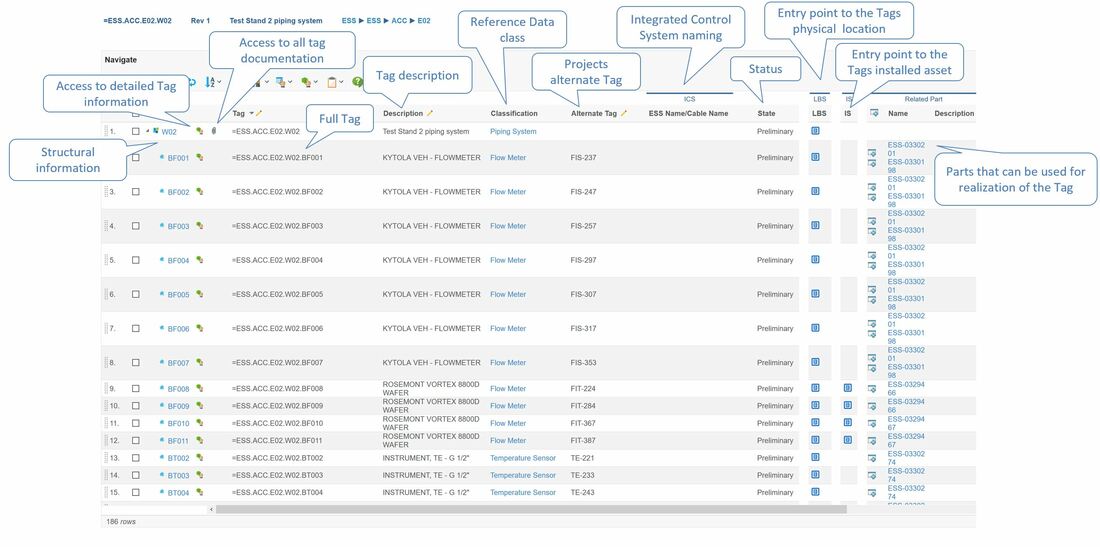
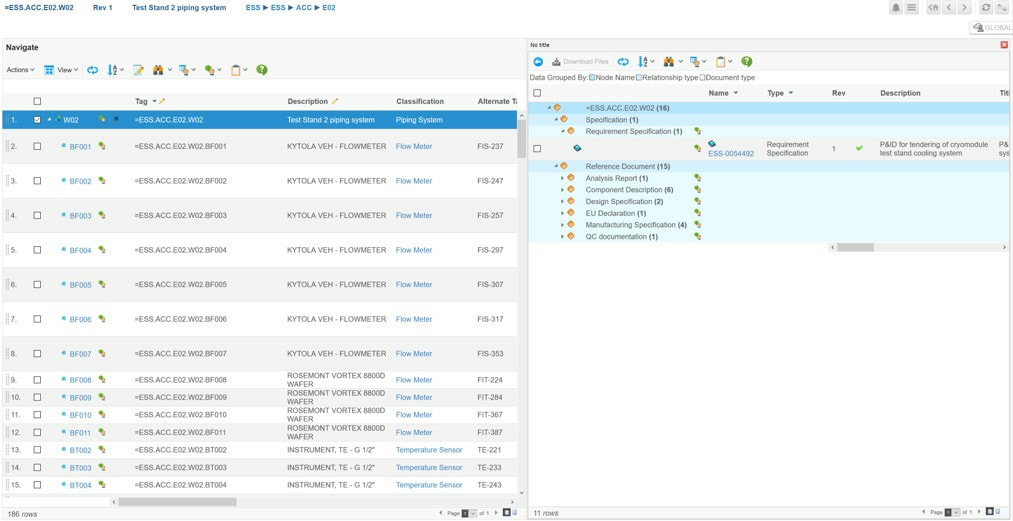
Both of these approaches have one important thing in common. They both heavily depend on a properly defined information model that can handle information exchange across multiple disciplines, software tools and even companies throughout the lifecycle of the facility.
To achieve that, interoperability is vital.
What does that mean then, and how can it be done?
The “PLM tales from a true mega-project” series and "Digital Twin - What needs to be under the hood?" offers ways of doing it.
A facility owner that owns multiple facilities would benefit even greater by having such a defined information model, as it can be shared across facilities and digital twins. This would allow for a new level of insight across facilities. As an example: if a certain type of equipment keeps failing during certain circumstances, it can immediately be analyzed if that type of equipment is used the same way not only in one facility, but in all other owned facilities as well. This would open up for a lot more effective knowledge sharing across all owned sites, and prevent un-necessary downtime.
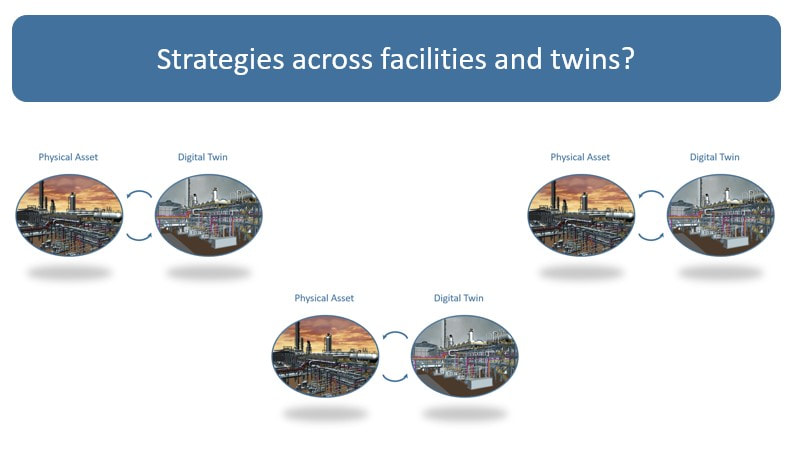
In my view, any facility owner embarking on a “digital twin” journey should pay great attention to the information model behind the “digital twin”, and devise strategies for how benefits can be utilized across a portfolio of twins as well as within a single twin.
After all, it does not make sense to do the same mistakes at every facility, when the knowledge to prevent it is there.
Bjorn Fidjeland
The two facility images used in this post is by Narmada Gharat and purchased at Dreamstime.com
After all, it does not make sense to do the same mistakes at every facility, when the knowledge to prevent it is there.
Bjorn Fidjeland
The two facility images used in this post is by Narmada Gharat and purchased at Dreamstime.com


 RSS Feed
