Follow us at
plmPartner
  • Home
  • About
  • Blog
  • Archive
  • Contact
  • Video Log
  • Learning Center
  • Privacy Policy

Opportunities and strategies - Product Configuration Lifecycle Management

4/25/2021

0 Comments

 
Picture

This time an article that aims towards the more traditional Product Lifecycle Management domain and especially towards configurable products or so called Configure To Order (CTO) products. This article is a direct result of discussions I’ve had with Henrik Hulgaard, the CTO of Configit, on Configuration Management in general and Product Configuration Management in particular. Configit specializes in Product Configuration Management, or as they prefer to call it Configuration Lifecycle Management.
 
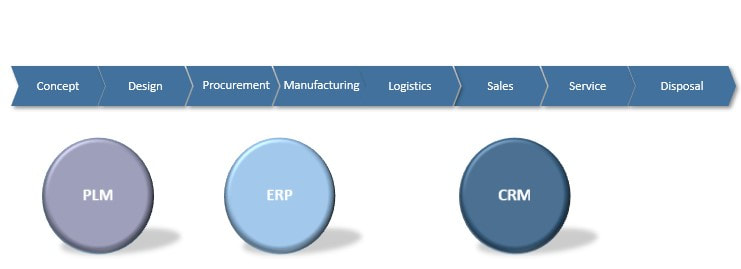
Most businesses that design, manufacture and sell products have a system landscape in place to support key areas during the lifecycle of a product pretty much as in the image below (there are of course differences from company to company).

​
Picture
Figure 1.

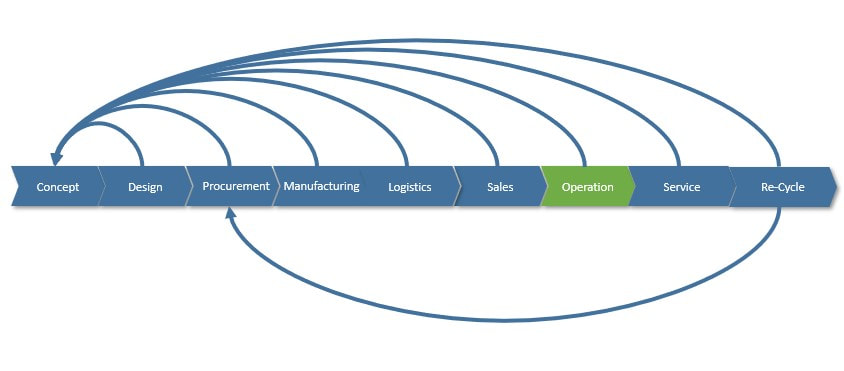
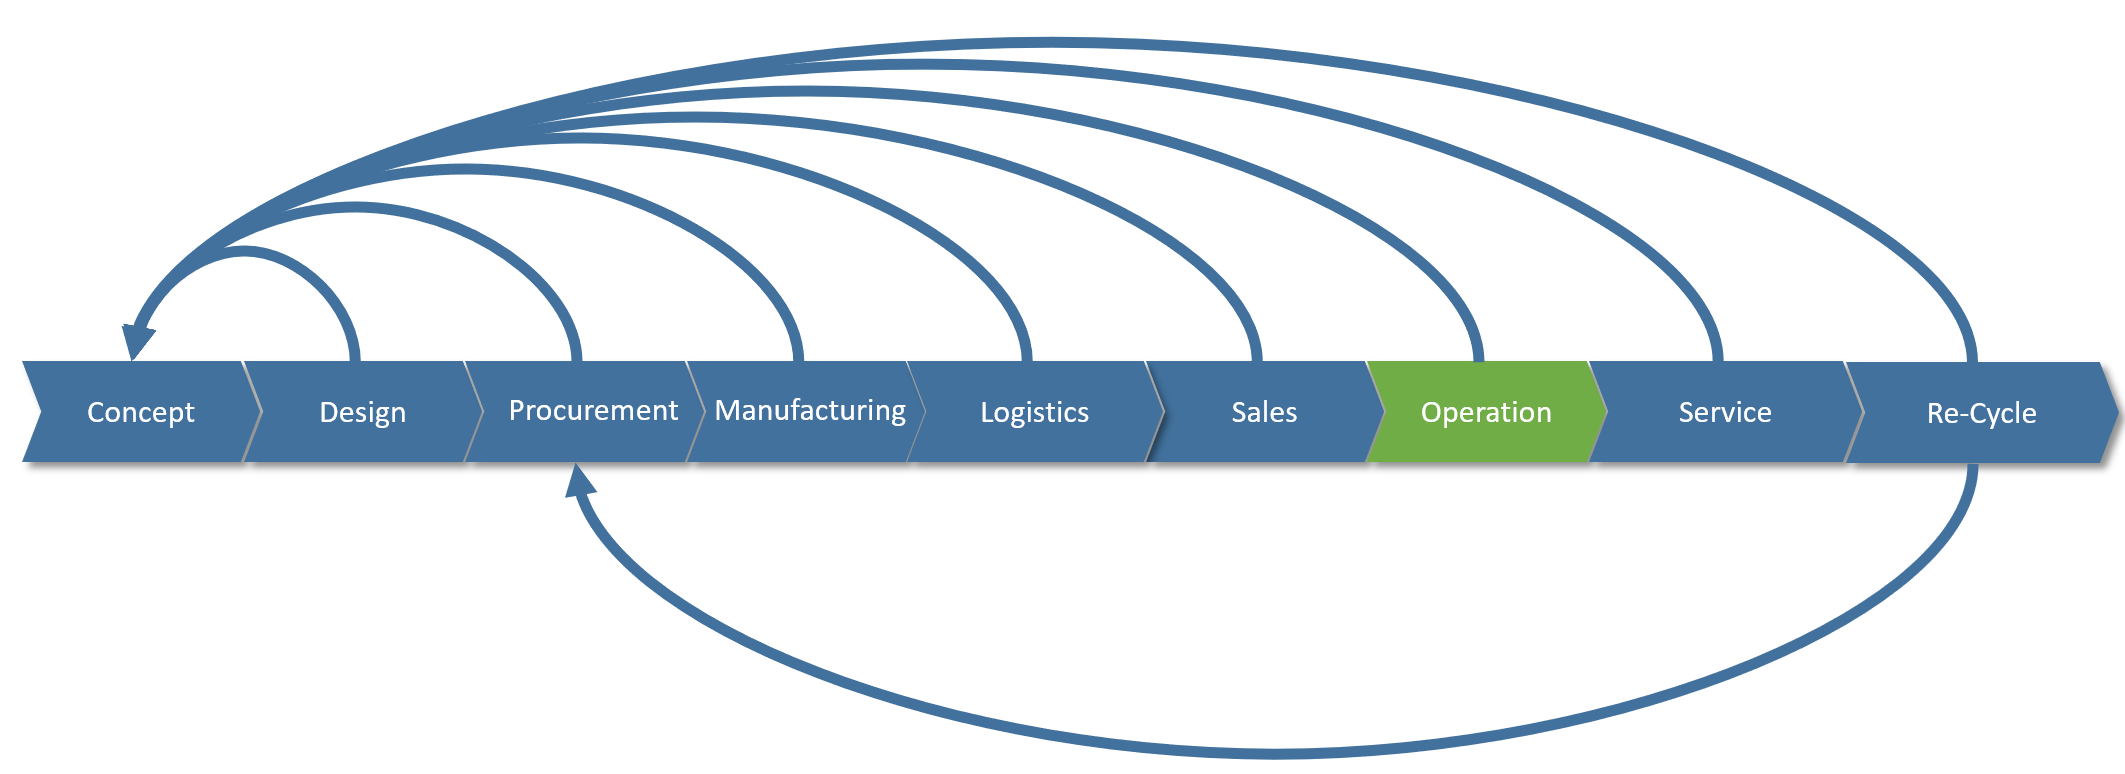
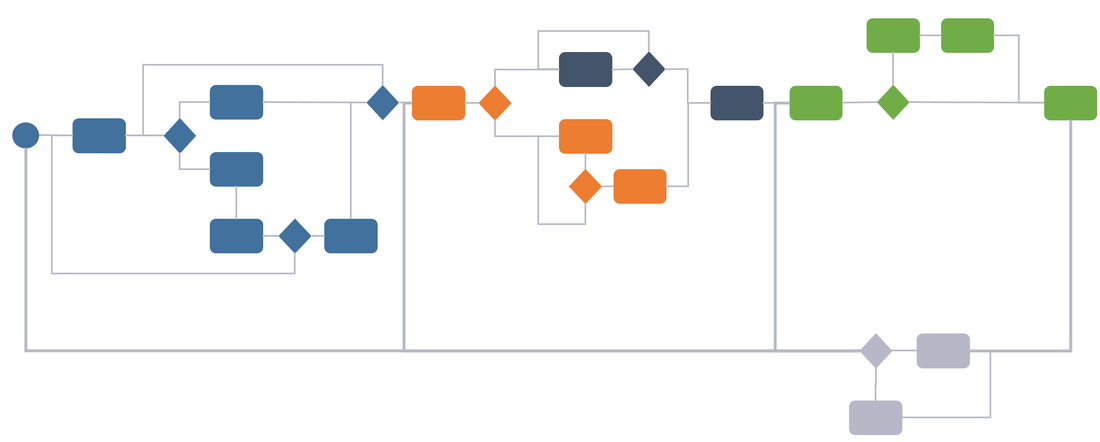
This works well as long as the product lifecycle is linear, like it has mostly been in the past. However, as more and more companies strive after being able to let customers “personalize” their products, (so, to configure them to support their individual personal needs), harvest data and behavior from “the field” through sensors to detect trends in usage as well as being able to offer new services while the product is in use (operational), the lifecycle cannot be linear anymore in my view. This is because all phases of the lifecycle need feedback and information from the other phases to some degree. You may call this “a digital thread”, “digital twin” or “digital continuity” if you will (figure 2).
Picture
Figure 2.

Such a shift puts enormous requirements on traceability and change management of data all the way from how the product was designed, through to how it is used, how it is serviced and ultimately how it is recycled. If the product is highly configurable, the number of variants of the product that can be sold and used is downright staggering.
Needless to say, it will be difficult to offer a customer good service if you do not know what variant of the product the customer has purchased, and how that particular instance of the product has been maintained or upgraded in the past.
 
So, what can a company do to address these challenges and also the vast opportunities that such feedback loops offer?

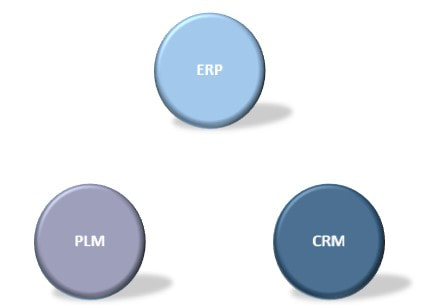
If we consider the three system domains that are normally present (there are often more), they are more often than not quite siloed. That is in my experience not because the systems cannot be integrated, but more as a result of organizations still working quite silo oriented (Figure 3).

​


Picture
Figure 3.

All companies I’ve worked with wants to break down these silos and internally become more transparent and agile, but what domain should take on the responsibility to manage the different aspects of product configuration data? I mean, there is the design & engineering aspect, the procurement aspect, the manufacturing aspect, the sales aspect, the usage/operation aspect, the service/maintained aspect and ultimately the recycling aspect.
 
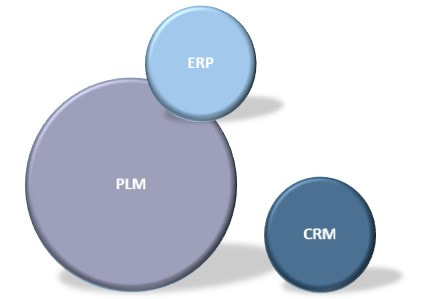
Several PLM systems today have configuration management capabilities, and it would for many companies make sense to at least manage product engineering configurations here, but where do you stop? I mean, sooner or later you will have to evaluate if more transactional oriented data should be incorporated in the PLM platform which is not a PLM system’s strongpoint (figure 4).
Picture
Figure 4.

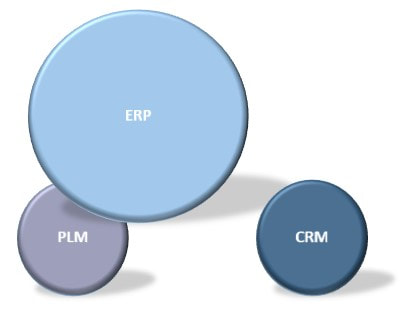
On the other hand, several ERP systems also offer forms of configuration management either as an addition or as part of their offering. The same question needs to be answered here. Where does it make most sense to stop as ERP systems are transactional oriented, while PLM systems are a lot more process and iteratively work oriented (figure 5).


Picture
Figure 5.

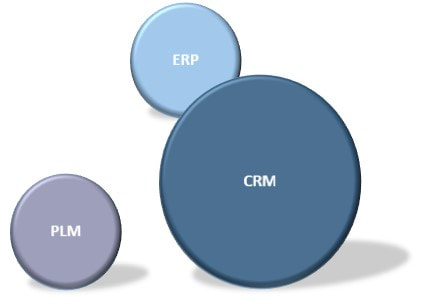
The same questions need to be asked and answered for the scenario regarding CRM. Where does it make sense to draw the boundaries towards ERP or PLM, like in figure 6.

​
Picture
Figure 6.

I have seen examples of companies wanting to address all aspect with a single software vendor’s portfolio, but in my experience, it only masks the same questions within the same portfolio of software solutions. Because, who does what, where and with responsibility for what type of data when, is not tackled by using a single vendor’s software. Those are organizational, and work process related questions, not software questions.
 
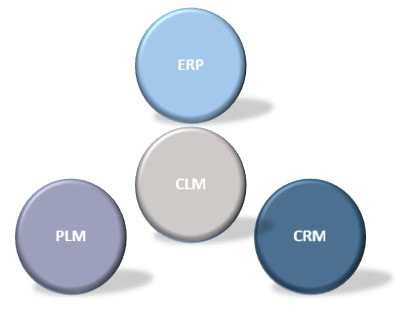
Another possible solution is to utilize what ERP, PLM and CRP systems are good at in their respective domains, and implement the adjoining business processes there. Full Product Configuration Management or Configuration Lifecycle Management needs aspects of data from all the other domains to effectively manage the full product configuration, so a more domain specific Configuration Management platform could be introduced.


Picture
Figure 7.

Such a platform will have to be able to reconcile information from the other platforms and tie it together correctly, hence it would need a form of dictionary to do that. In addition, it needs to define or at least master the ruleset defining what information from PLM can go together with what information in ERP and CRM to form a valid product configuration that can legally be sold in the customer’s region.

As an example, consider: What product design variant that meets the customer requirements can be manufactured most cost effectively and nearest the customer with the minimal use of resources and still fulfill regulatory requirements in that customers country or region?
These are some of the questions that must be answered.

More strategic reasons to evaluate a setup like in figure 7 could be:
  • As the departmental silos in an organization is often closely linked to the software platform domain, it might be easier to ensure collaboration and acceptance by key stakeholders across the organization with a “cross-cutting” platform that thrives on quality information supplied by the other platforms.
  • It poses an opportunity for companies with a strategy of not putting too many eggs in the basket of one particular software system vendor.
  • It could foster quality control of information coming from each of the other domains as such a CLM solution is utterly dependent on the quality of information from the other systems.
  • Disconnects in the information from the different aspects can be easily identified.

I would very much like to hear your thoughts on this subject.
​
Bjorn Fidjeland 


​The header image used in this post is by plmPartner
0 Comments

PLM tales from a true megaproject Ch. 6 – Asset Management

12/15/2019

1 Comment

 
Picture
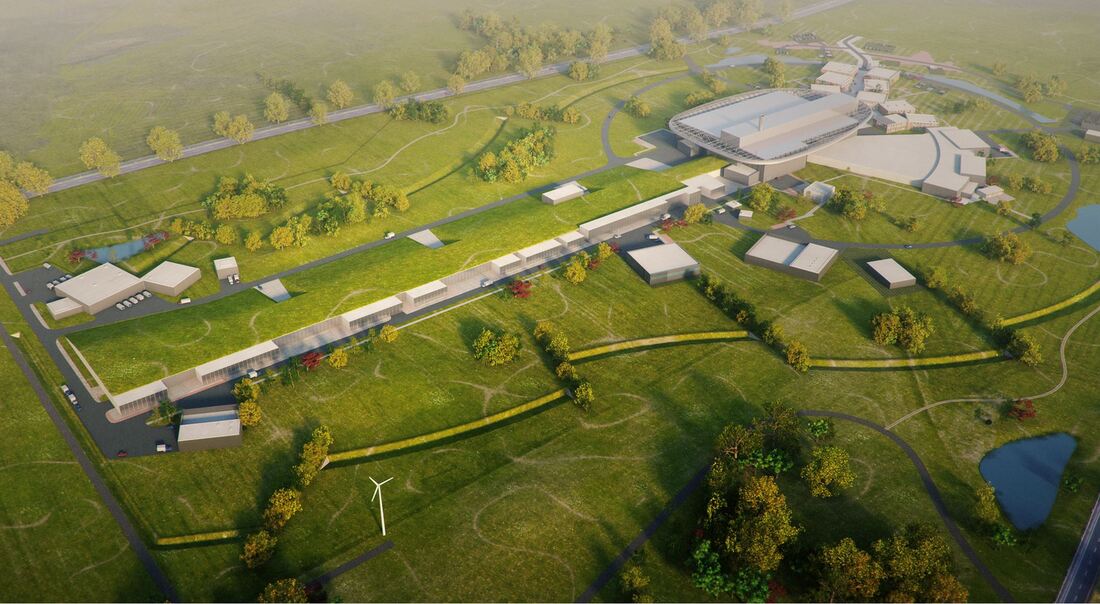
Image courtesy of European Spallation Source ERIC
​

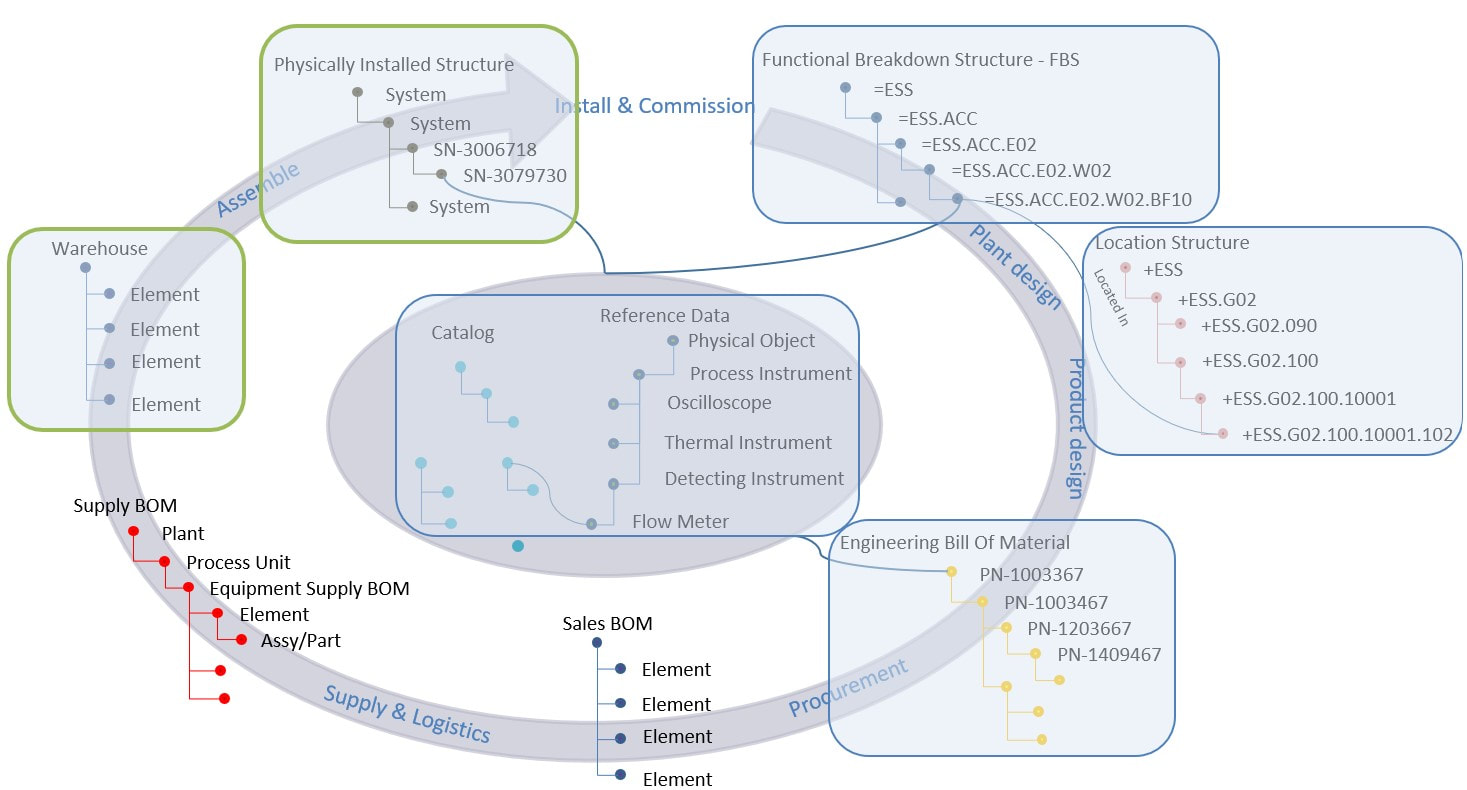
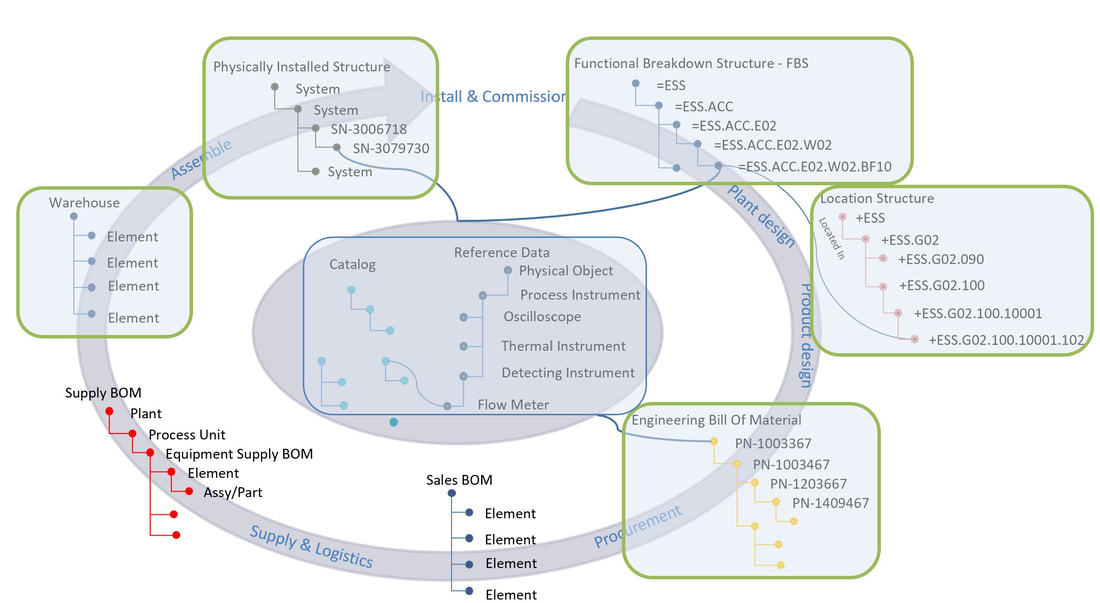
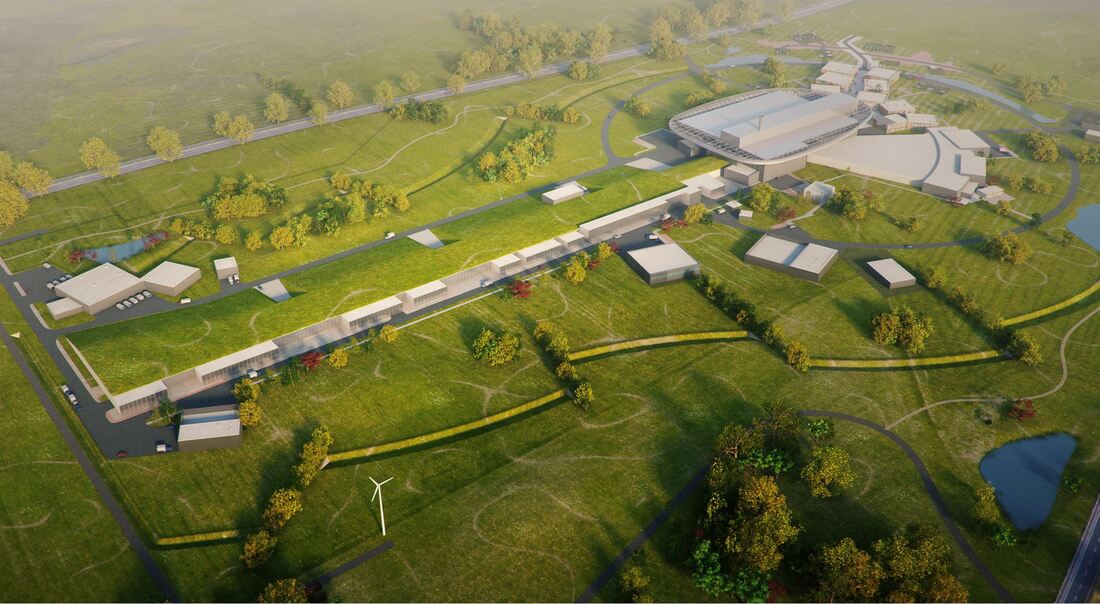
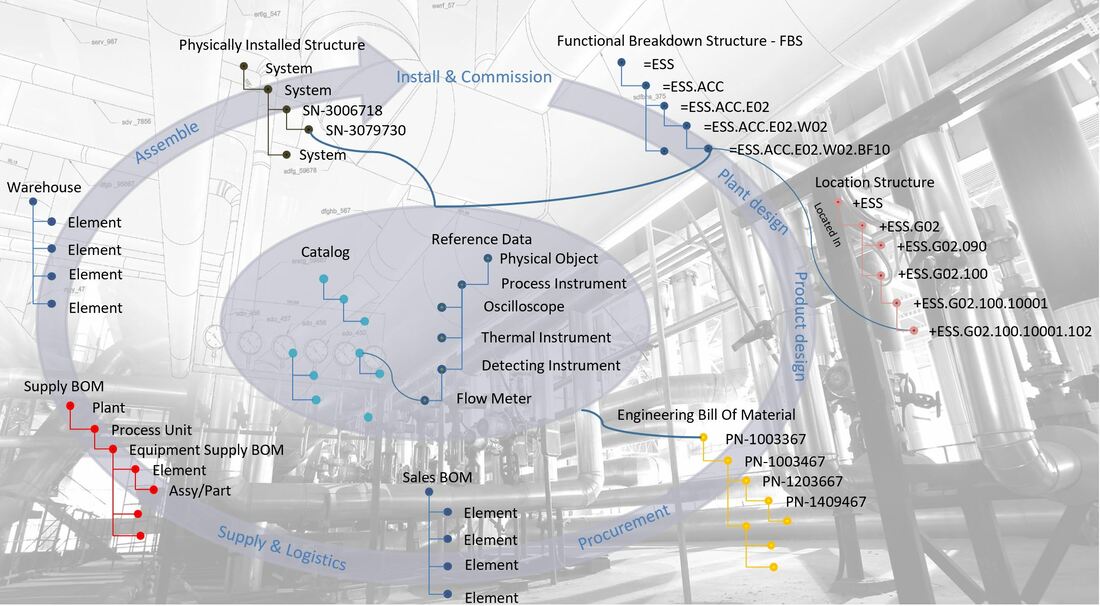
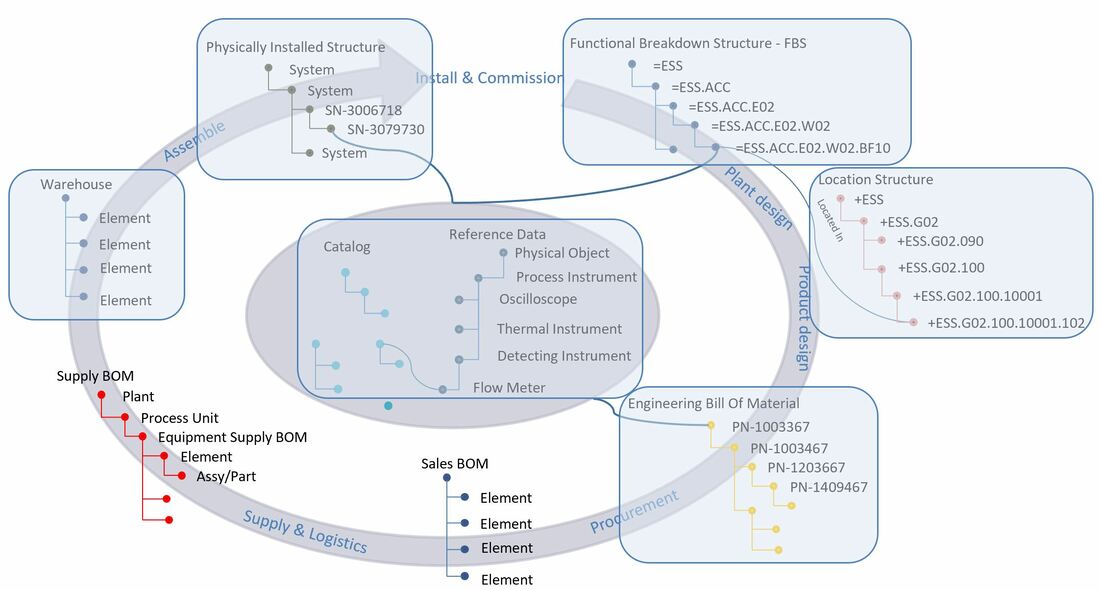
In this chapter we’re going to take a look at how physically installed assets are treated from an information management perspective, how assets are related to their specifying tag information, physical location and work performed on the assets themselves from arrival on site to installation and commissioning.
If you would like to read previous chapters first before we take a deeper dive, you can find them all here: Archive


​
Picture
Figure 1.
​
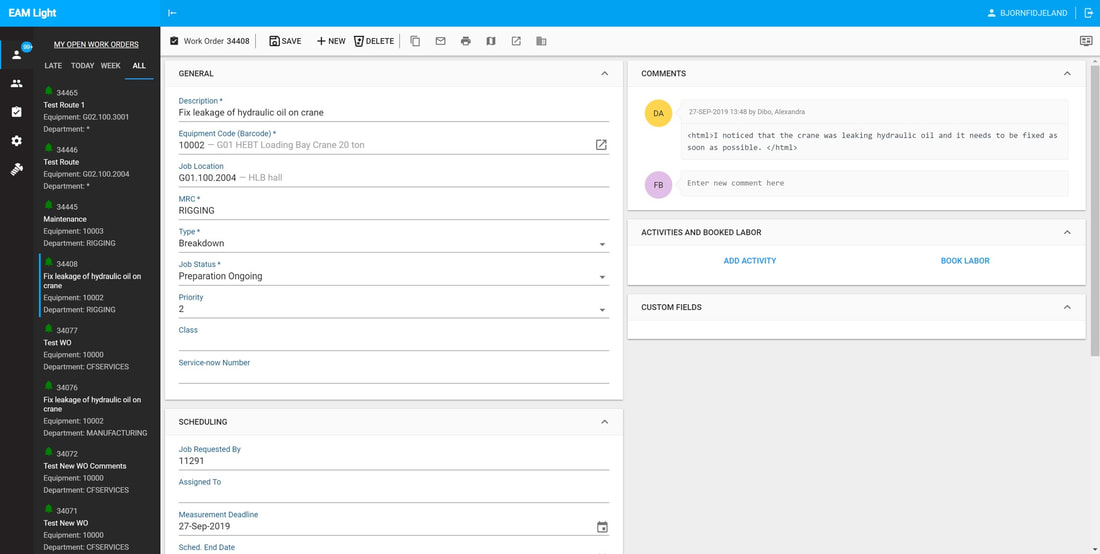
As physical assets arrive at ESS they are registered in the Enterprise Asset Management (EAM) system through a goods receival process, and work orders are then required to install the asset to fulfill the tag requirements stated in the Functional Breakdown structure during design and engineering.
​
Picture
Figure 2. Image courtesy of European Spallation Source ERIC

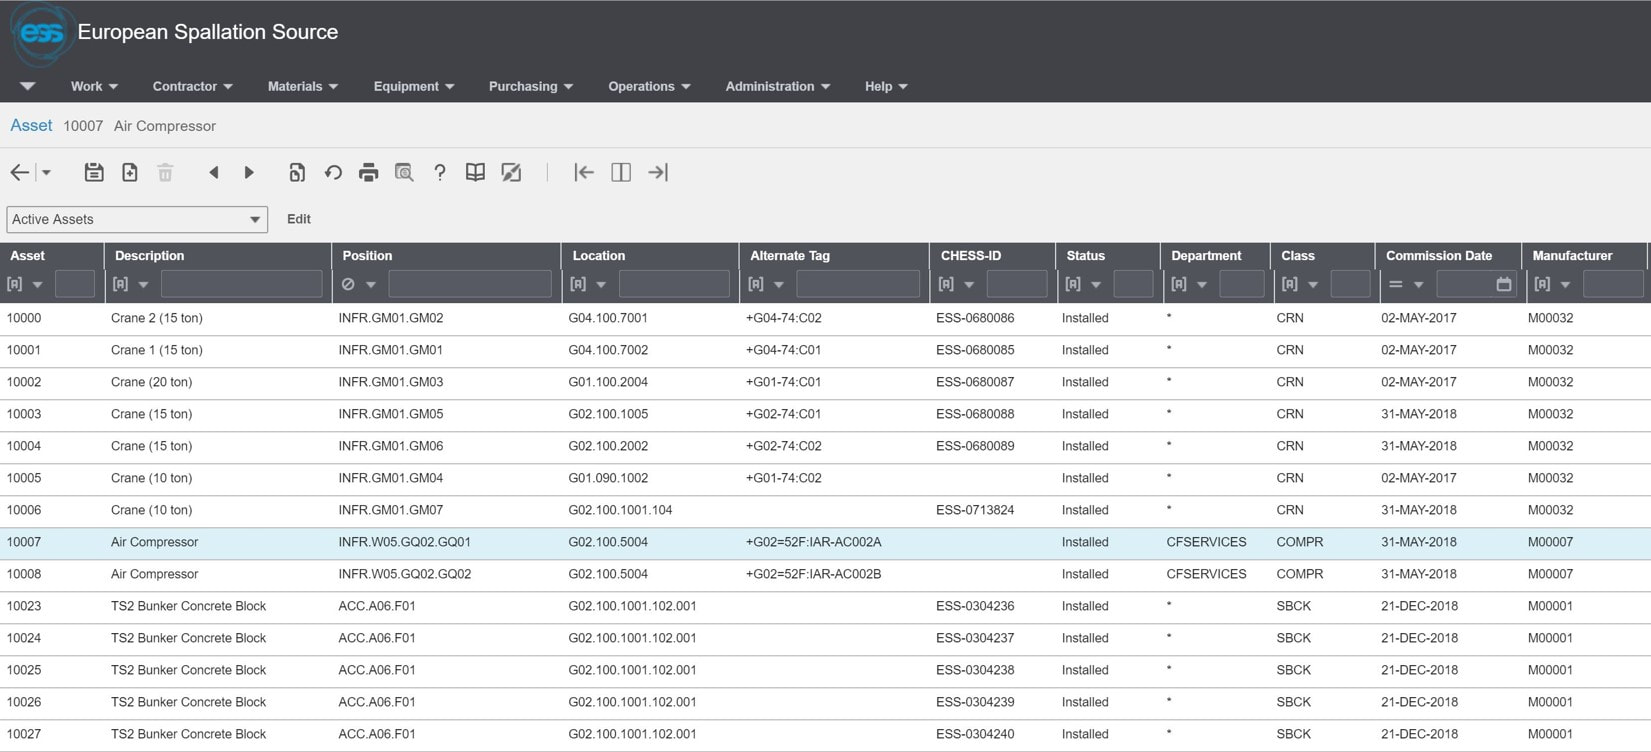
Figure 2 is from the Enterprise Asset Management system and shows a subset of installed assets. Note that the tags they fulfil are called Positions. Information regarding tag/position, location etc. comes from the plant PLM system via integration whereas the asset information is registered in the EAM system and managed there. All asset documentation is then fed back to the plant PLM system for consolidation across all information structures. 
Picture
Figure 3. Image courtesy of European Spallation Source ERIC

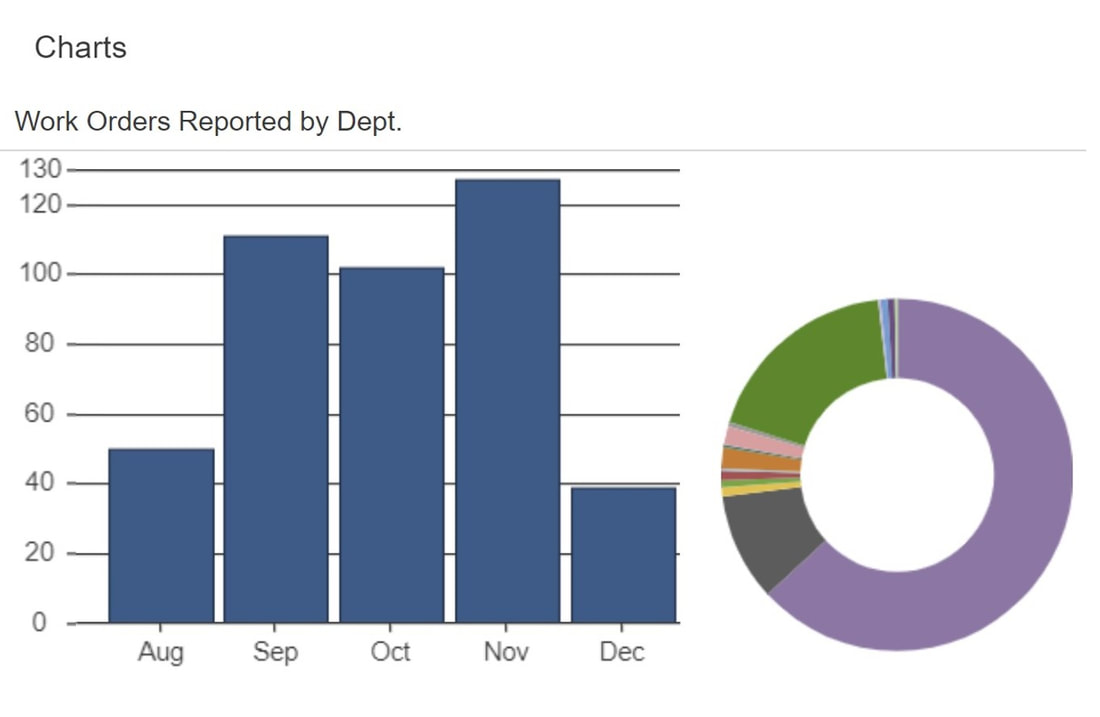
The EAM system governs work performed on assets in the facility from preparation and rigging to installation work orders, commissioning and maintenance work orders. Figure 3 shows a chart of different types of work orders executed over a short period of time.
​
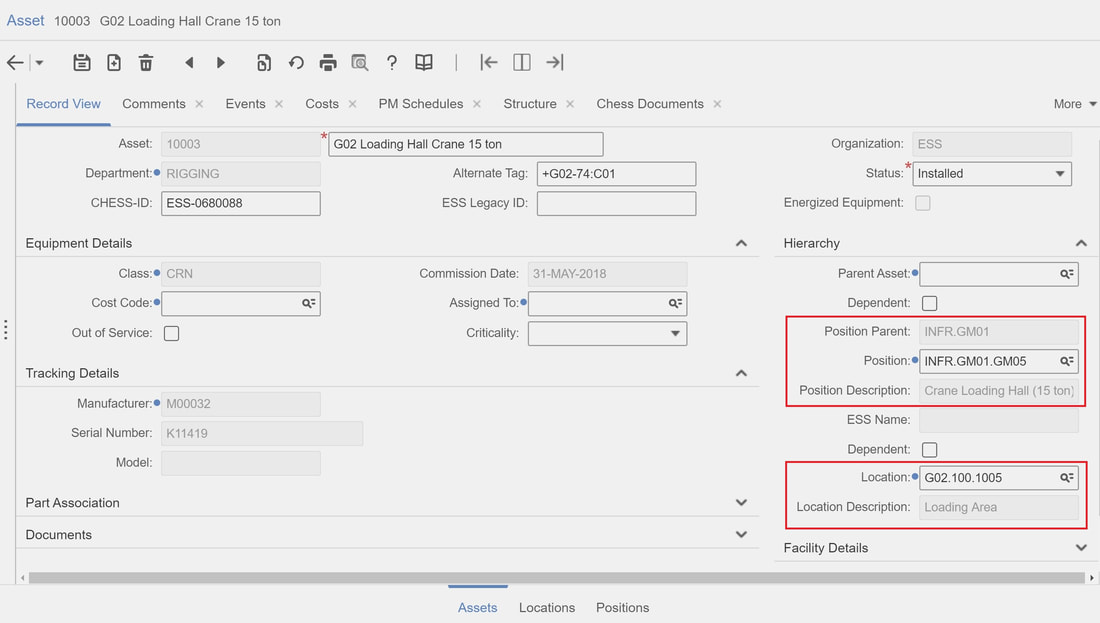
The information from the plant PLM system entered during design and engineering is now put to good use as it provides all information about what function the asset is supposed to fulfil in the facility, how it should be calibrated and where it is to be installed. All this information is accessible directly from the EAM system for the people performing the work.
Picture
Figure 4. Image courtesy of European Spallation Source ERIC

Figure 4 shows detailed information about the asset. Through the Position/Tag and Location, all information and documentation from engineering is available. Furthermore, we can see that the asset is installed and that commissioning has been performed.
​
All documentation including needed certification regarding the Asset, together with design documentation is available through one screen for maintenance personnel. To make access and input of relevant information easier for persons working in the field, a simple user interface for rugged hand held devices has been put in place as an overlay to the EAM system.
Picture
Figure 5. Image courtesy of European Spallation Source ERIC

So with this, the “information circle” is complete with structured data all the way from design and engineering through installation, commissioning, operations and maintenance.
Picture
Figure 6. Image courtesy of European Spallation Source ERIC
 
Using this principle has allowed the European Spallation Source to move from document centric handovers between lifecycle phases to data centric transitions where the handover is in terms of responsibility for the data needed.

But hold on a second. This all explains the different data structures needed throughout the plant lifecycle. However, it does not explain how data on the different entities across the structures can be interpreted and compared to gain meaning and insight. So, how to achieve interoperability of data across disciplines and software tools?

That will be the topic of my next article in this series.

It is my hope that this article can serve as inspiration for other companies as well as software vendors. I also want to express my gratitude to the European Spallation Source and to Peter Rådahl, Head of Engineering and Integration department in particular for allowing me to share this with you.
​
Bjorn Fidjeland
1 Comment

PLM tales from a true megaproject Ch. 3

5/23/2019

0 Comments

 
Picture
Image courtesy of European Spallation Source ERIC

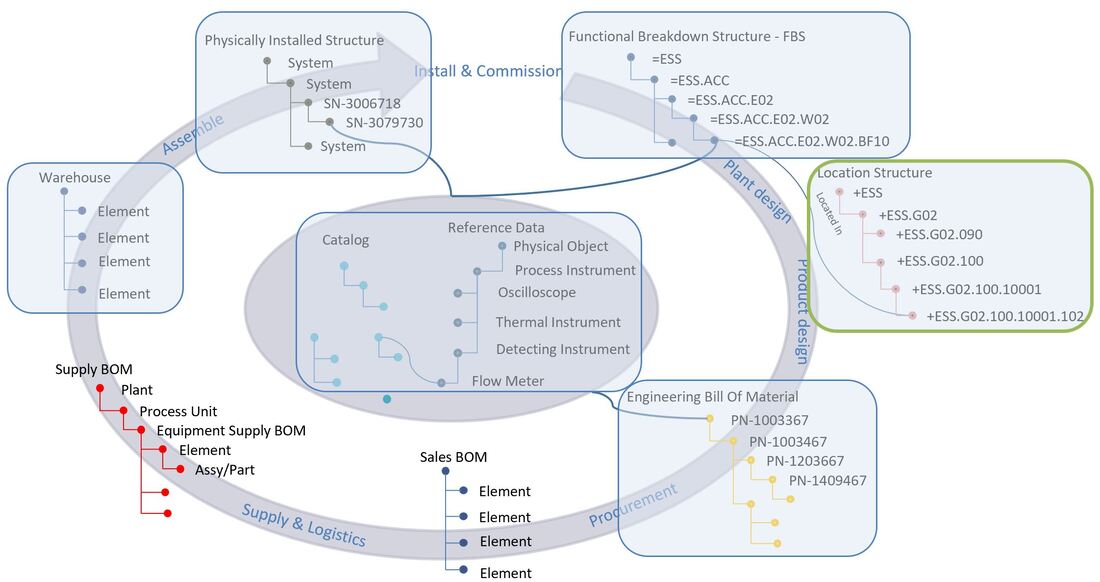
In this chapter we are going to take a look at how the location breakdown structure is implemented at the European Spallation Source.
The location structure is a decomposition of physical locations of areas into buildings, levels, rooms, cells and sub-cells. The Location Breakdown Structure contains a consolidated view of all data from a physical location perspective.
​
This chapter is built up much the same way as the previous one about the functional breakdown structure, due to their similar look and feel, even though they describe different aspects of the facility. 

If you would like to read previous chapters first before we take a deeper dive, you can find it here:
PLM tales from a true megaproject Ch. 1
PLM tales from a true megaproject Ch. 2 – Functional Breakdown Structure
If you’d like to familiarize yourself more with the concepts of the different structures, please visit:
Plant Information Management - Information Structures


Picture
Figure 1.

When examining the location breakdown structure, you’ll notice that is looks like it also has a form of tag.
​This is entirely correct, the standard used at ESS, EN/ISO 81346, was among other things selected for its ability to name multiple aspects, where the functional aspect is indicated with a equal sign, and the location aspect is indicated with a plus sign. 
​
Picture
Figure 2. Image courtesy of European Spallation Source ERIC

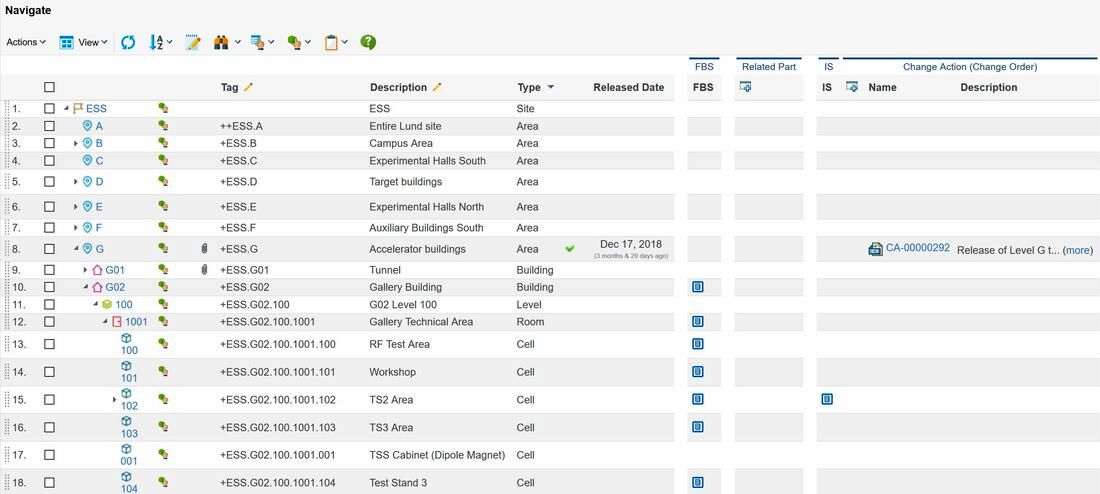
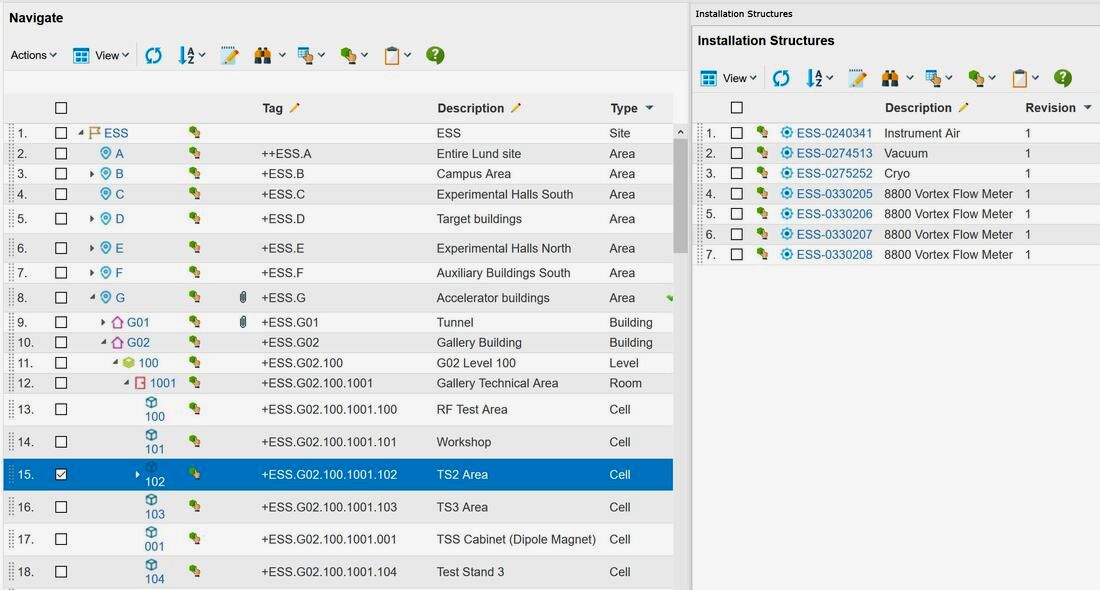
The image above is from the plant PLM system and shows a small part of the location breakdown structure at ESS.
Let’s go through what we see in the image, and use the TS2 Area (Test Stand 2) row 15 – +ESS.G02.100.1001.102 as an example.
​
Picture
Figure 3. Image courtesy of European Spallation Source ERIC

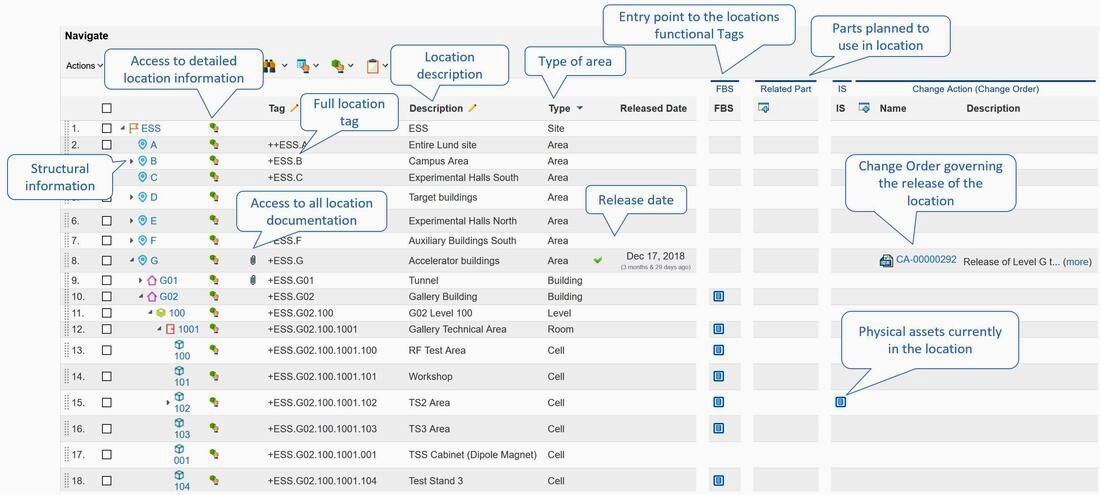
The first column shows the location name of the individual location object.
The second column with the little green icon gives you the option to zoom in on the location if further details are needed, for instance attribute values of the location such as owner of the location, status, specifications, reference documents, history etc.

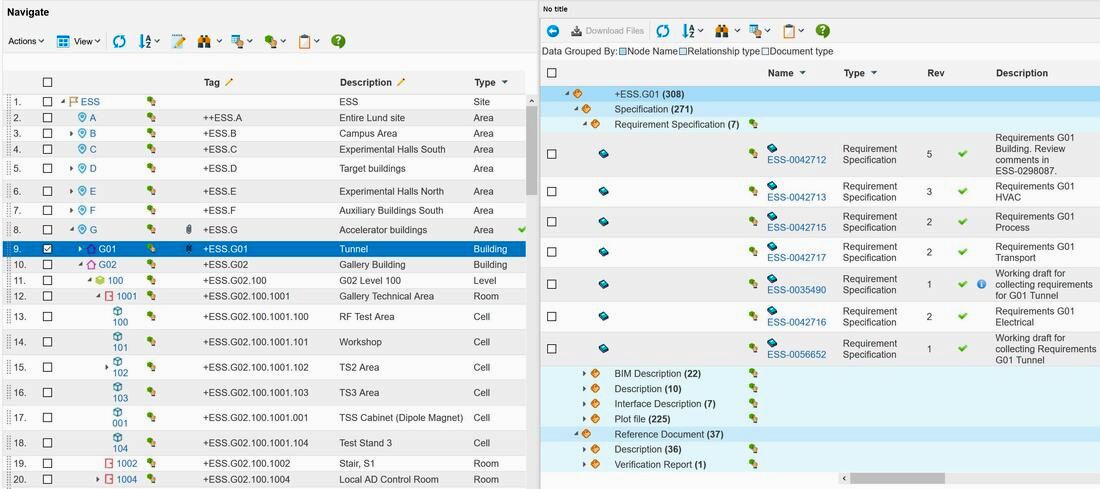
The third column shows a paperclip if there are specifying documentation associated with the location. In figure 4 we can see that the Tunnel has 308 documents associated whereas 271 of them are considered specifying documentation to the location and 7 are requirement specifications (the green check mark means that it has the lifecycle state released). We can also see that 37 documents are regarded as reference documents. This means that they are describing the location, but are not regarded as specifying to the location.
​
Picture
Figure 4. Image courtesy of European Spallation Source ERIC

The Tag column shows the full location tag , and the description column indicates a description of the location.
The type column indicates the type of area. At ESS this can be area, building, level (where 100 is floor level), room, cell and sub cells.
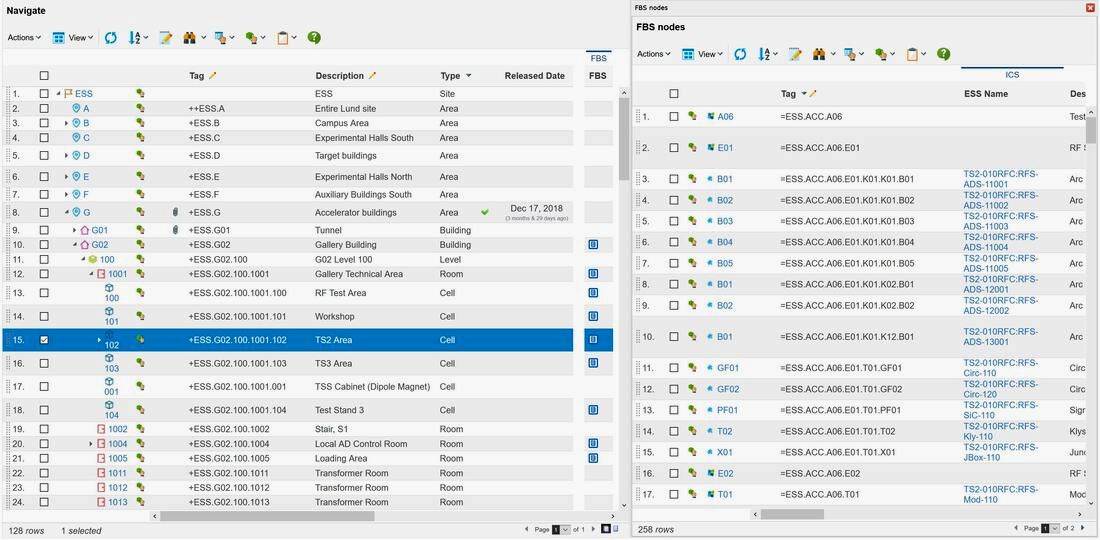
The FBS (Functional Breakdown Structure) column in figure 3 allows you to see at what functional locations, so Tags, the physical location actually contains. The functional locations are displayed in the split view as shown in figure 5.
​
Picture
Figure 5. Image courtesy of European Spallation Source ERIC

We can clearly see that the TS2 Area currently contains 258 functional tags (master tags), and all information regarding each functional tag is directly available in this view.

The IS column in figure 3 refers to the actually installed assets in the plant that is used to implement the functional object requirements that are located in the physical location of TS2 Area (an asset is a physical thing that typically has a serial number). See figure 6.
​
Picture
Figure 6. Image courtesy of European Spallation Source ERIC

The released part column in figure 3 gives an overview of what released product designs (Engineering Bill Of Materials) or standard parts that can fulfill the functional object requirements physically located in the TS2 Area (there might be several options prior to procurement, however the installed asset will only have an association to one part as it was manufactured based on that particular product design).

The last column in figure 3, called Change Order displays a link to the Change Order responsible for releasing the physical location together with all specifying documentation.

So, from one view in the plant PLM system, the European Spallation Source is able to access all related data to all physical locations in their location breakdown structure from engineering and design through installation, commissioning, operations, maintenance and ultimately decommissioning.

The next chapter will be about how ESS manages product design (Engineering Bill Of Materials), both from an Engineer To Order perspective and a serial manufacturing perspective.

It is my hope that this article can serve as inspiration for other companies as well as software vendors. I also want to express my gratitude to the European Spallation Source and to Peter Rådahl, Head of Engineering and Integration department in particular for allowing me to share this with you.

Bjorn Fidjeland
0 Comments

PLM tales from a true megaproject Ch. 2

4/12/2019

0 Comments

 
Picture
Image courtesy of Fabien Rey, Group Leader Machine Engineering Service Group at European Spallation Source ERIC

In this chapter we are going to take a look at how the functional breakdown structure is implemented at the European Spallation Source. The functional structure is a functional decomposition of systems and subsystems all the way down to individual functions, or as ESS calls them, components. The Functional Breakdown Structure contains a consolidated view of data from all plant engineering disciplines including electrical, plant & process and mechanical.
If you would like to read chapter one first before we take a deeper dive, you can find it here:

PLM tales from a true megaproject Ch. 1

If you’d like to familiarize yourself more with the concepts of the different structures, please visit:
Plant Information Management - Information Structures and
Plant Engineering meets Product Engineering in capital projects


​
Picture
Figure 1.

The first thing you’ll notice is the tagging. It was decided to use the standard EN/ISO 81346 as a common master tag at the European Spallation Source. The equal sign means that it is the functional aspect, however anybody familiar with the standard will notice something a bit odd. The first 2 levels are not quite according to standard. It was decided that the first level was to be ESS, and the second levels ACC (Accelerator), TS (Target Station), NSS (Neutron Scattering Systems) and INFR (Infrastructure). Anything below the first and second level is according to the guidelines of the standard.


Picture
Figure 2. Image courtesy of European Spallation Source ERIC

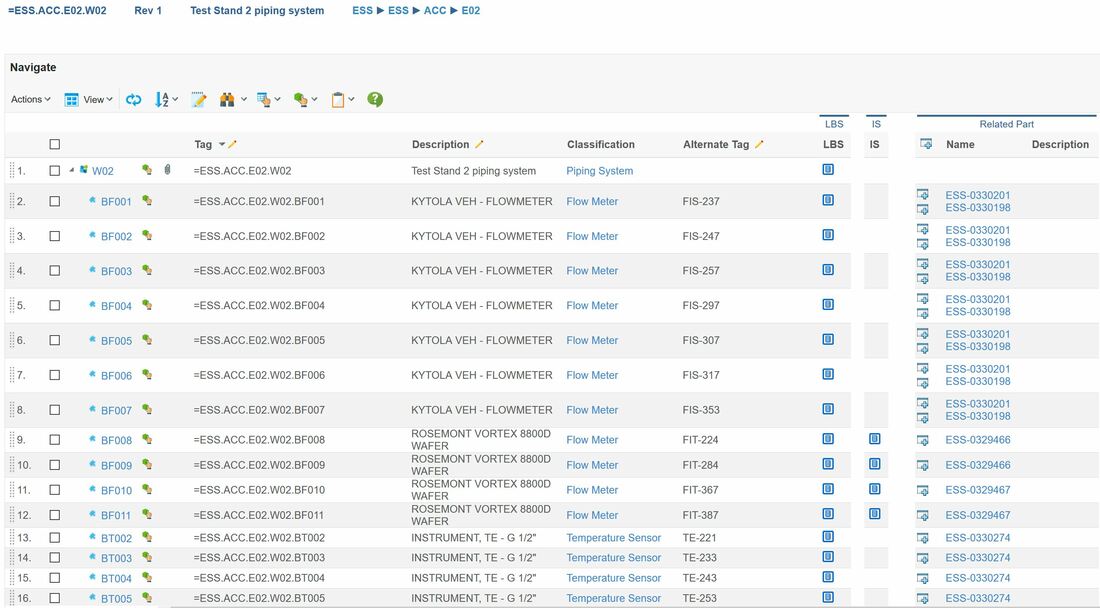
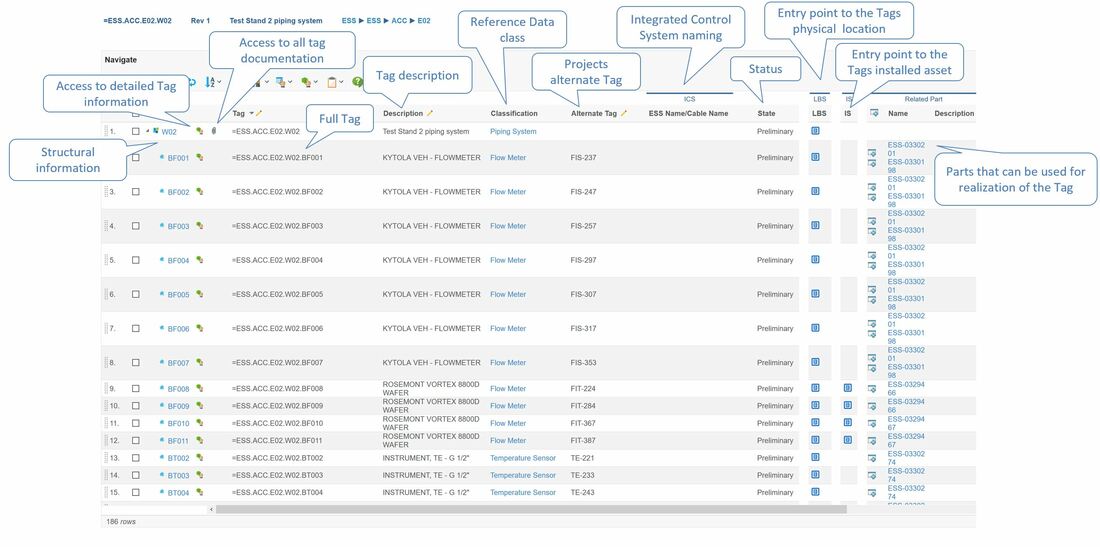
The image above is from the plant PLM system and shows the functional breakdown structure of the Test Stand 2 piping system as an example. At the time of writing, the functional breakdown structure contains about 50.000 tags, but is expected to grow to well over 1 million tags.
Let’s go through what we see in the image, and use the first row – W02 (the Test Stand 2 piping system) as an example in the beginning.

​
Picture
Figure 3. Image courtesy of European Spallation Source ERIC

The first column shows the tag name of the individual functional object (W02). The second column with the little green icon gives you the option to zoom in on the object if further details are needed, for instance all the attribute values of the object coming from object type or class (European Spallation Source uses ISO 15926-4 as a basis for their master reference data).
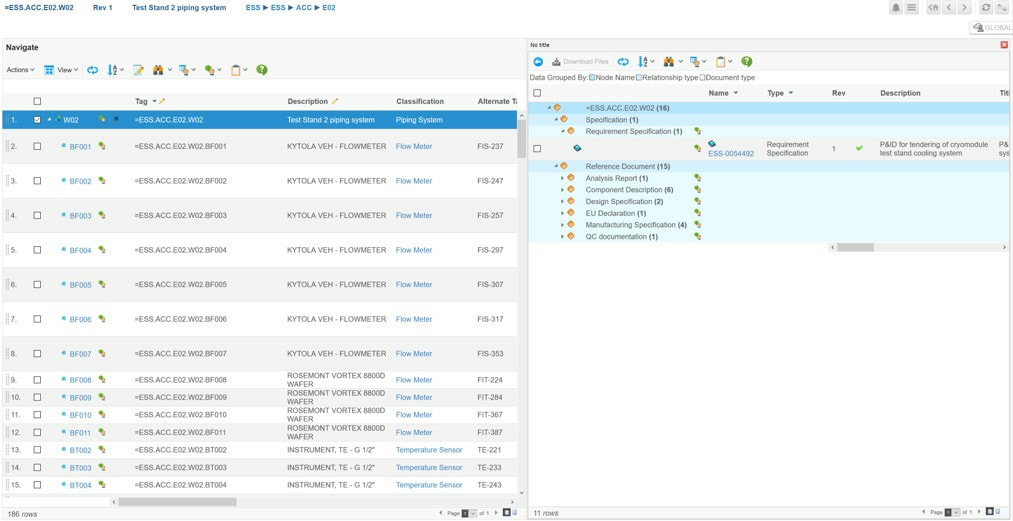
The third column shows a paperclip if there are specifying documentation associated with the tag. In figure 4 we can see that the Test Stand 2 piping system has one released P&ID (the green check mark means that it has the lifecycle state released), and that there are 15 other reference documents associated.

​​
Picture
Figure 4. Image courtesy of European Spallation Source ERIC

The Tag column shows the full functional master tag, and the description column indicates a description of the functional object.
The classification column shows what kind of functional object it is. This refers to the master reference data class that is used to describe the properties or attributes this specific tag has got. In order to explain better we need to take a step back.
​
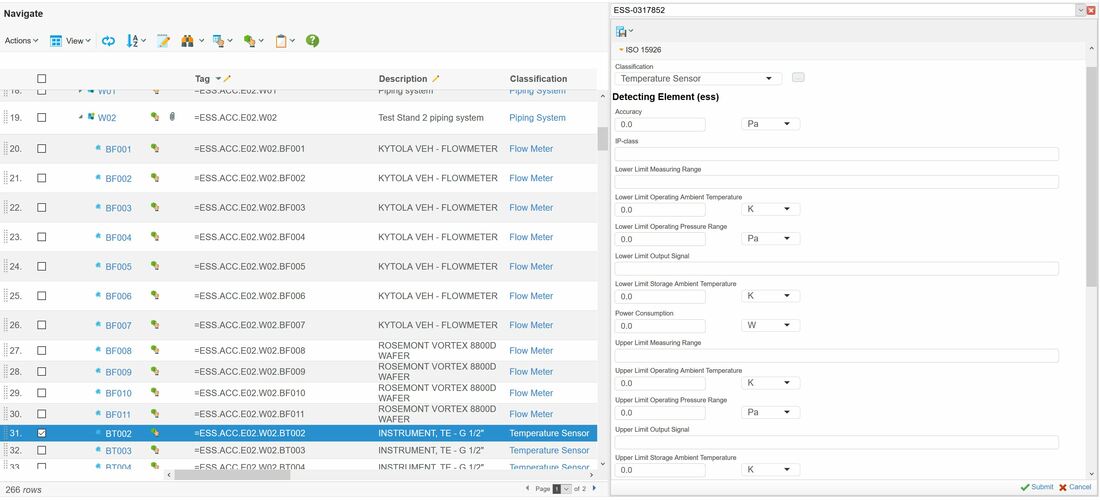
I mentioned that the European Spallation Source opted to use ISO 15926-4 as a basis for their master reference data. This means that there is a vast library of classes that defines what attributes, let’s say a Temperature Sensor should have, and also what letter codes (defined based on EN 81346) it should have. So, when a functional object is first created, it only has basic attributes that are shared across all functional objects, however when the system is told that it is a Temperature Sensor, it gets all the attributes defined for the class Temperature Sensor in addition to it’s tag which is computed by the parent object’s tag, the letter code and the number of other Temperature Sensors at this level in the functional breakdown structure plus one.

​
Picture
Figure 5. Image courtesy of European Spallation Source ERIC

The image above shows some of the attributes for the selected Temperature Sensor tag, but without operational data.
​
The LBS (Location Breakdown Structure) column in figure 3 allows you to see at what physical location the functional object is located.
If the functional object is a pipe or cable that spans multiple locations, then several physical locations are displayed in the split view as shown in figure 6.

​
Picture
Figure 6. Image courtesy of European Spallation Source ERIC

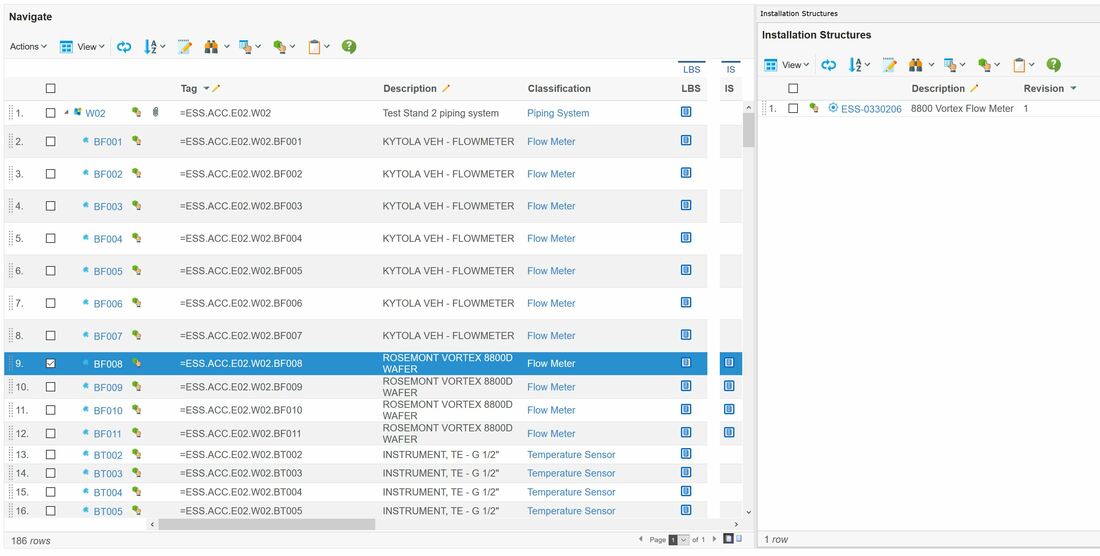
The IS column in figure 3 refers to the actually installed asset in the plant that implements the functional object requirements (physical item with serial number). See figure 7.

​
Picture
Figure 7. Image courtesy of European Spallation Source ERIC
​
The released part column in figure 2 gives an overview of what released product designs (Engineering Bill Of Materials) or standard parts that can fulfill the functional object requirements (there might be several options prior to procurement, however the installed asset will only have an association to one part as it was manufactured based on that particular product design).
 
So from one view in the plant PLM system, the European Spallation Source is able to access all related data to all functional objects in their functional breakdown structure from design and engineering through installation, commissioning, operations, maintenance and ultimately decommissioning.
The next chapter will be about the Location Breakdown Structure.

It is my hope that this article can serve as inspiration for other companies as well as software vendors. I also want to express my gratitude to the European Spallation Source and to Peter Rådahl, Head of Engineering and Integration department in particular for allowing me to share this with you.


Bjorn Fidjeland
0 Comments

PLM tales from a true mega-project Ch. 1

3/27/2019

0 Comments

 
Picture
Image courtesy of European Spallation Source ERIC

I’ve been asked on several occasions if I can share some more details from any of the projects I’ve been involved with. Especially the ones addressing plant lifecycle management and the use of structured data.
Naturally, most commercial companies who face fierce competition every day are reluctant to do so, as it is deemed highly important for their competitiveness. Or as one client put it “This is truly our backbone, while our master-data is our lifeblood”

​
Picture
However, there is one very special company I’ve been fortunate to be involved with for several years now who has agreed to share some of their details.
​It is the European Spallation Source ERIC or ESS for short. An organization tasked with executing a true mega-project, to design, build and operate the world’s brightest neutron source for scientific use.

So what is the European Spallation Source?
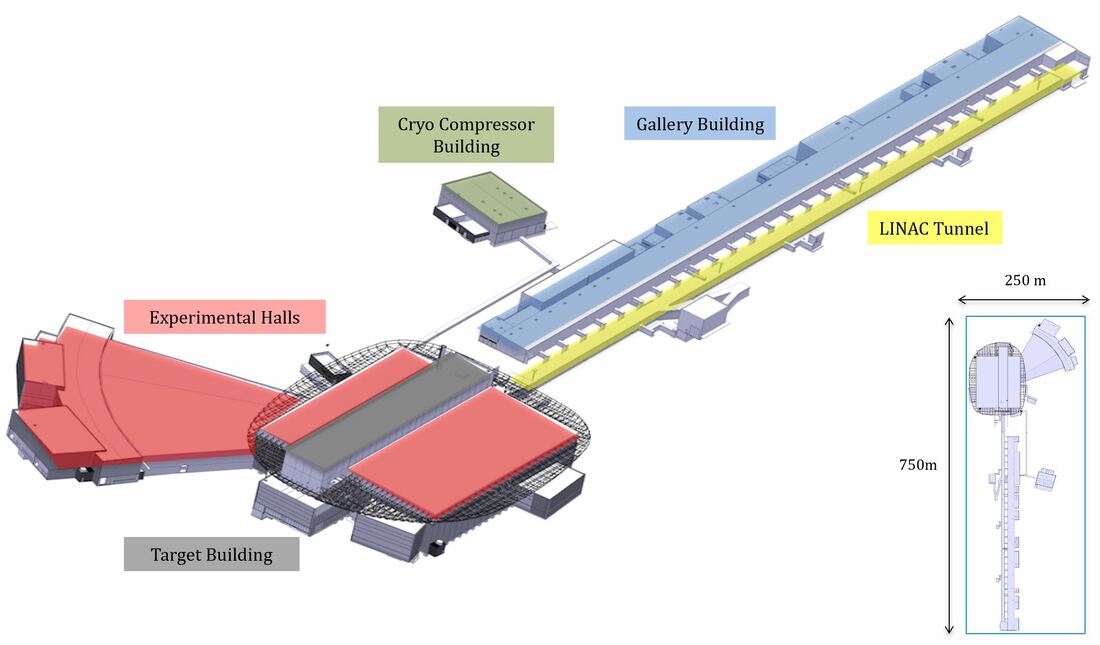
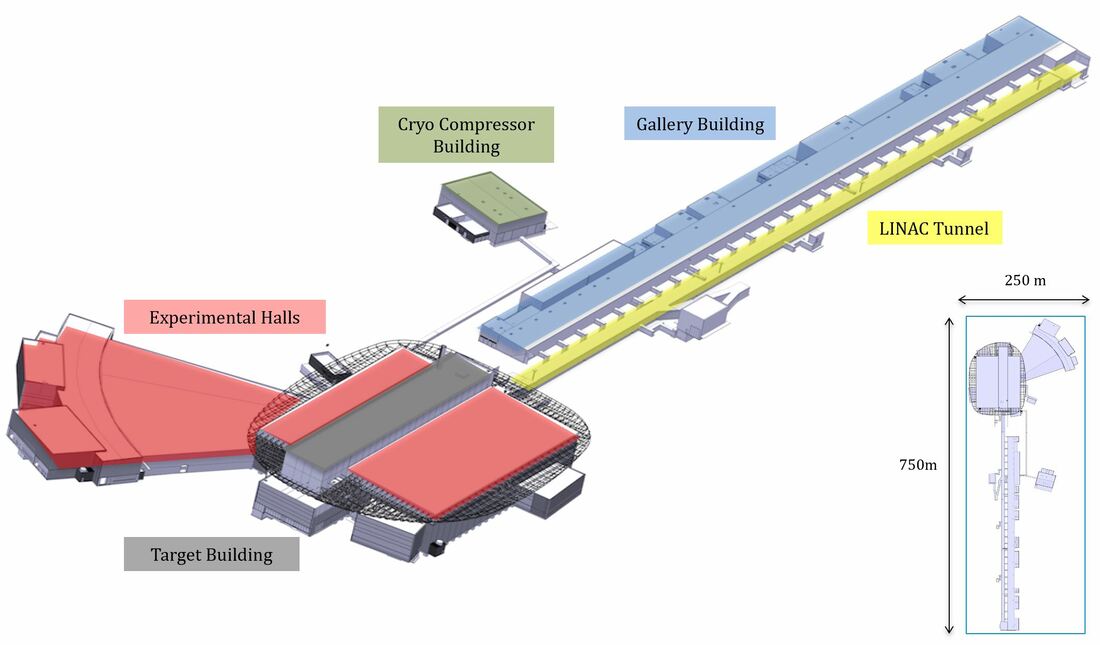
In short it is a 750 meters long and 250 meters wide facility that houses a huge linear proton accelerator or LINAC. The accelerator is responsible for accelerating protons produced by an Ion Source up to 96% of the speed of light. The protons are then collided into the target which is a 2.6 m-diameter stainless steel disk containing bricks of a neutron-rich heavy metal called Tungsten. This is where Spallation occurs, where neutrons are flung out from the target wheel. These neutrons are the main product of the European Spallation Source, and they are guided through neutron guides to the instruments that allow researchers to do their research. It is anticipated that 22 instruments will be installed in total.
For more information, check out europeanspallationsource.se

​
Picture
Image courtesy of Fabien Rey, Group Leader Machine Engineering Service Group at European Spallation Source ERIC
 
What kind of research will be conducted?
Some examples are: chemistry of materials, magnetic & electronic phenomena, life science & soft condensed matter, engineering materials, geosciences, archeology & heritage conservation, fast neutron applications and particle physics

Well, back to the real question at hand. What have they done with respect to plant lifecycle management and technical information management?
If you want to freshen up on my views with respect to needed information structures, you may do so here:
Plant Information Management - Information Structures
Archive of articles

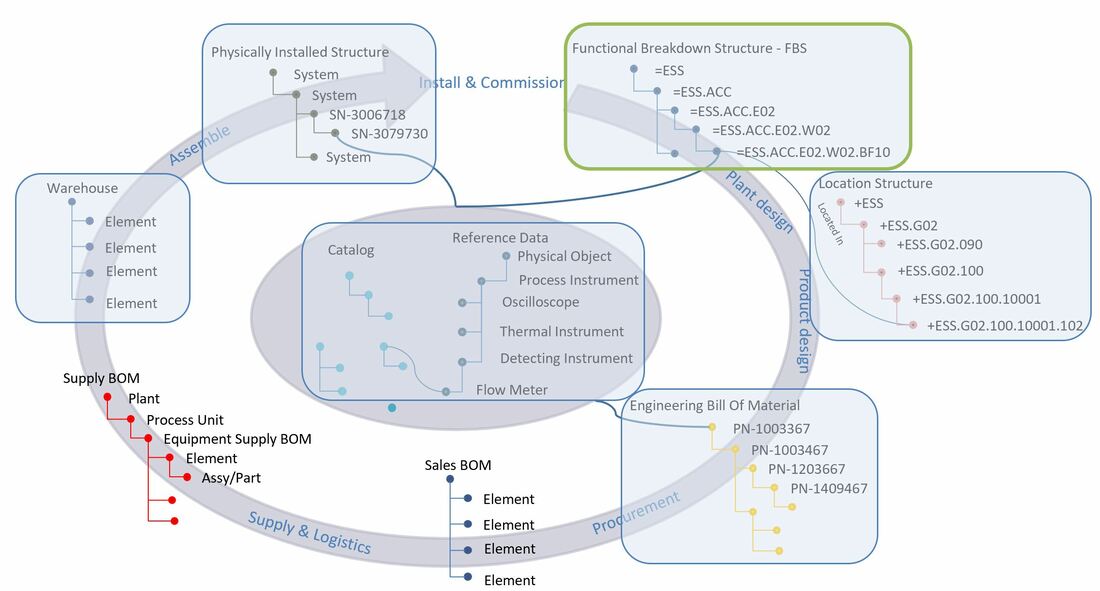
What ESS has put in place is truly remarkable. By extending a Product Lifecycle Management (PLM) system to also manage:
  • Functional Breakdown Structure (Tags)
  • Location Breakdown Structure (Physical Locations)
  • Engineering Bill of Material (EBOM for product designs, traditionally the home turf of a PLM system)
  • Management of all installed assets or physically installed items (the front end for asset management and warehouse management is an Enterprise Asset Management system, whereas assets installed in the facility are also created and consolidated in the PLM system together with relationships to their corresponding Tag, Location, Part and their common reference data class with attributes)
Reference data: A class library of common reference data used across Functional Breakdown Structure, Engineering Bill of Material and Assets. Each class has attributes defined deemed important to ESS.

​
Picture
In addition to the actual data structures, each object in any structure is governed by revision control and change management, not only of the objects themselves but also their associated specifications in the form of 3D design models, drawings, certificates and reports etc.

Why has the European Spallation Source done this when they are only building one such facility?
The main reason is to support the European Spallation Source evolution from project to a sustainable facility enabling world-leading science for ≥40 years, and to establish the foundation needed for future cost-efficient operation and maintenance.
 
A second reason is the fact that the facility in some areas is producing radiation in the form of radioactivity. This means that parts of the facility fall under the regulatory requirements of the Swedish Radiation Safety Authority which in turn means rigorous control of all technical information as well as configuration management of such information.
​
In the coming articles I will address each information structure, as well as the topics of digital twin, master reference data, change management and revision control with live examples from the European Spallation Source.

In this regard I would like to offer a special thanks to Peter Rådahl, Head of Engineering and Integration department at the European Spallation Source whom I’ve had the privilege to serve as an advisor for several years now. Peter Raadahl had a clear vision from the start on how to best serve the European Spallation Source with respect to managing technical information, formed a strategy for how to get there and stuck to the strategy through many an obstacle.
 
Bjorn Fidjeland
0 Comments

Big Data and PLM, what’s the connection?

1/3/2018

3 Comments

 
Picture
I was challenged the other day to explain the connection between Big Data and PLM by a former colleague. The connection might not be immediately apparent if your viewpoint is from traditional Product Lifecycle Management systems which primarily has to do with managing the design and engineering data of a product or plant/facility.

However, if we first take a look at a definition of Product Lifecycle Management from Wikipedia:

“In industry, product lifecycle management (PLM) is the process of managing the entire lifecycle of a product from inception, through engineering design and manufacture, to service and disposal of manufactured products. PLM integrates people, data, processes and business systems and provides a product information backbone for companies and their extended enterprise.”
​
Traditionally it has looked much like this
Picture
Then let’s look at a definition of Big Data
​

“Big data is data sets that are so voluminous and complex that traditional data processing application software are inadequate to deal with them. Big data challenges include capturing data, data storage, data analysis, search, sharing, transfer, visualization, querying, updating and information privacy. There are three dimensions to big data known as Volume, Variety and Velocity.
Lately, the term "big data" tends to refer to the use of predictive analytics, user behavior analytics, or certain other advanced data analytics methods that extract value from data, and seldom to a particular size of data set. "There is little doubt that the quantities of data now available are indeed large, but that’s not the most relevant characteristic of this new data ecosystem." Analysis of data sets can find new correlations to "spot business trends, prevent diseases, combat crime and so on.”

Included in Big Data you’ll find data sets harvested from sensors within all sorts of equipment and products as well as data fed back from software running within products. One can say that a portion of Big Data is the resulting feedback from the Internet of Things. Data in itself is not of any value whatsoever, but if the data can be analyzed to reveal meaning, trends or knowledge about how a product is used by different customer segments then it has tremendous value to product manufacturers.
If we take a look at the operational phase of a product, and by that, I mean everything that happens from manufactured product to disposal, then any manufacturer would like to get their hands on such data, either to improve the product itself or sell services associated with it. Such services could be anything from utilizing the product as a platform for an ecosystem of connected products to new business models where the product itself is not the key but rather the service it provides. You might sell guaranteed uptime or availability provided that the customer also buys into your service program for instance.

 
The resulting analysis of the data should in my view be managed by, or at least serve as input to the product definition because the knowledge gleamed from all the analytics of Big Data sets ultimately impacts the product definition itself since it should lead to revised product designs that fulfills the customer needs better. It might also lead to the revelation that it would be better to split a product in two different designs going after two distinct end user behavior categories found as a result of data analysis from the operational phase of the products.
​
Connected products, Big Data and analysis will to a far greater extent than before allow us to do the following instead:
Picture
It will mean that experience throughout the full lifecycle can be made available to develop better products, tailor to new end user behavior trends and create new business models.

Note: the image above focuses on the feedback loops to product engineering, but such feedback loops should also be made available from for instance service and operation to manufacturing.

Most companies I work with tell me that the feedback loops described in the image above is either too poor, or virtually nonexistent. Furthermore, they all say that such feedback loops are becoming vital for their survival as more and more of their revenue comes from services after a product sale and not from the product sale itself. This means that it is imperative for them to have as much reliable and analyzed data as possible about their products performance in the field, how their customers are actually using them and how they are maintained.

For these companies at least, the connection between Big Data analysis and its impact on Product Lifecycle Management is becoming clearer and clearer.


Bjorn Fidjeland


The header image used in this post is by garrykillian and purchased at dreamstime.com

3 Comments

Who owns what data when…..?

7/7/2017

0 Comments

 
Picture
​A vital questions when looking at cross departmental process optimization and integration is in my view: who owns what data when in the overall process? 
Picture
Usually this question will spark up quite a discussion between the process owners, company departments, data owners and the different enterprise architects. The main reason for this is that depending on where the stakeholders have their main investment, they tend to look at “their” part of the process as the most important and the “master” for their data.

Just think about sales with their product configurators, engineering with CAD/PLM, supply chain, manufacturing & logistics with ERP and MES. Further along the lifecycle you encounter operations and service with EAM, Enterprise Asset Management, systems sometimes including MRO, Maintenance Repair and Operations/Overhaul. The last part being for products in operational use. Operations and service is really on the move right now due to the ability to receive valuable feedback from all products used in the field (commonly referred to as Internet of Things) even for consumer products, but hold your horses on the last one just for a little while.
​
The different departments and process owners will typically have claimed ownership of their particular parts of the process, making it look something like this:
Picture
This would typically be a traditional linear product engineering, manufacturing and distribution process. Each department has also selected IT tools that suit their particular needs in the process.
This in turn leads to information handovers both between company departments and IT tools, and due to the complexity of IT system integration, usually, as little as possible of data is handed from one system to the next.
​
So far it has been quite straight forward to answer “who owns what data”, especially for the data that is actually created in the departments own IT system, however, the tricky one is the when in “ who owns what data when”, because the when implies that ownership of certain data is transferred from one department and/or IT system to the next one in the process. In a traditional linear one, such information would be “hurled over the wall” like this:
Picture
Now, since as little information as possible flowed from one department / IT system to the next, each department would make it work as best as they could, and create or re-create information in their own system for everything that did not come directly through integration.
Only in cases where there were really big problems with lacking or clearly faulty data, an initiative would be launched to look at the process and any system integrations that would be affected.

The end result being that the accumulated information throughout the process that can be associated with the end product, that is to say the physical product sold to the consumer, is only a fraction of the actual sum of information generated in the different department’s processes and systems.
​
Now what happens when operations & services get more and more detailed information from each individual product in the field, and starts feeding that information back to the various departments and systems in the process?
Picture
The process will cease to be a linear one, it becomes circular with constant feedback of analyzed information flowing back to the different departments and IT systems.

Well what’s the problem you might ask.

The first thing that becomes clear is that each department with their systems does not have enough information to make effective use of all the information coming from operations, because they each have a quite limited set of data concerning mainly their discipline.

Secondly, the feedback loop is potentially constant or near real-time which will open up for completely new service offerings, however, the current process and infrastructure going from design through engineering and manufacturing was never built to tackle this kind of speed and agility.

Ironically, from a Product Lifecycle Management perspective, we’ve been talking about breaking down information and departmental silos in companies to utilize the L in PLM for as long as I can remember, however the way it looks now, it is probably going to be operations and the enablement of Internet Of Things and Big Data analytics that will force companies to go from strictly linear to circular processes.

And when you ultimately do, please always ask yourself “who should own what data when”, because ownership of data is not synonymous with the creation of data. Ownership is transferred along the process and accumulates to a full data set of the physically manufactured product until it is handed back again as a result of fault in the product or possible optimization opportunities for the product.

 – And it will happen faster and faster
​
Bjorn Fidjeland


The header image used in this post is by Bacho12345 and purchased at dreamstime.com
0 Comments

Plant Information Management - Installation and Commissioning

1/27/2017

0 Comments

 
Picture
I realize that the last post “Handover to logistics and supply chain in capital projects” went quite a lot further in the information lifecycle than the headline suggested, so here is a brief recap on how structured and linked data can support processes during construction/installation and commissioning.

This post is a continuation of the posts in the Plant Information Management series of:
 “Handover to logistics and supply chain in capital projects”
“Plant Engineering meets Product Engineering in capital projects”
 “Plant Information Management - What to manage?”

Let’s jump in and follow the journey of the manufactured physical products as they move into installation and commissioning phases.
​
Picture
Figure 1.
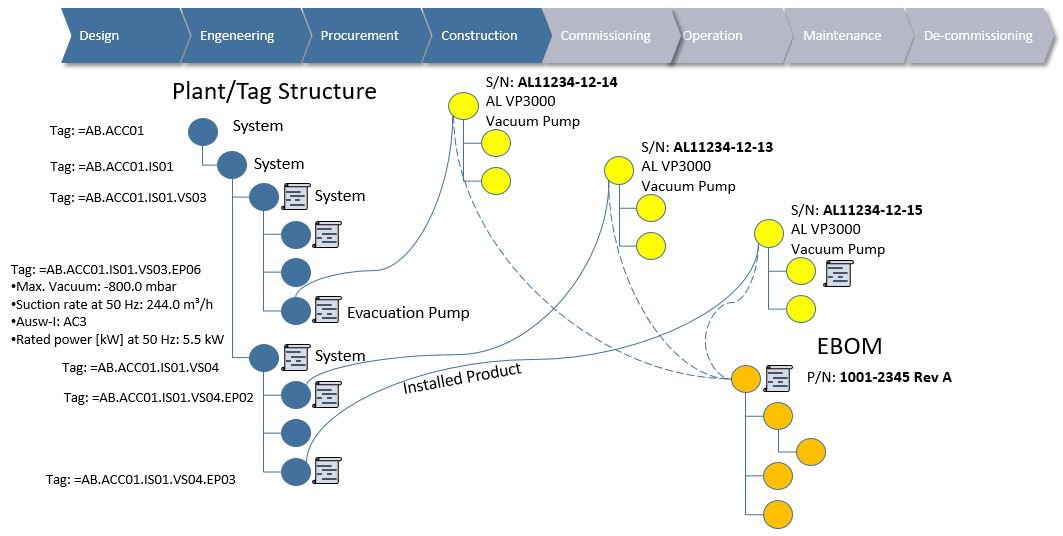
Provided that the information from the different structures and their context in relation to each other is kept, it is possible to trace perfectly what physical items should be installed where, corresponding to the tag requirements in the project (note: I’ve removed the connections from tag to EBOM in this figure for clarity).

We are now able to connect the information from tag: =AB.ACC01.IS01.VS04.EP03, the one in the safety classed area to the physical item with serial number S/N: AL11234-12-15 that contains the documentation proving that it is fit for purpose in a safety classed area.
As the other two tags are not in a safety classed area, and have no special requirements, any of the two physical pumps can be used to fulfill the tag requirements, however we still want full traceability for commissioning, operations & maintenance.
​
Picture
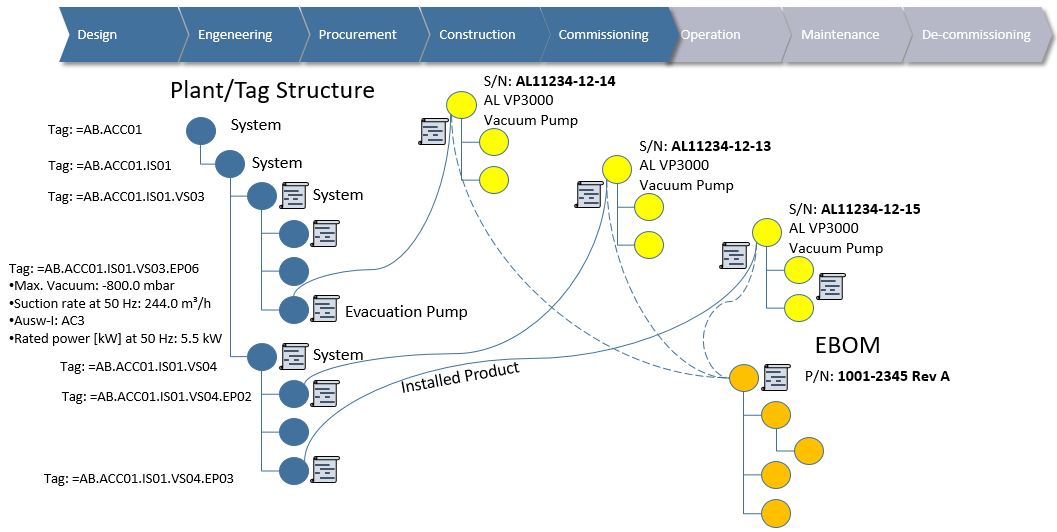
Figure 2.
Since we now have a connection between the tag requirements and the physically installed individuals, we can commence with various commissioning tests and verify that what we actually installed works as intended in relation to what we designed (the plant system), and furthermore we can associate certificates, commissioning documentation and processes to the physical individuals.

The reason for this split between tag object and physical item object I’d like to come back to in a future post regarding operations and maintenance.


Bjorn Fidjeland

The header image used in this post is by Satori13 and purchased at dreamstime.com

0 Comments

Handover to logistics and supply chain in capital projects

12/12/2016

1 Comment

 
Picture
This post is a continuation of the post “Plant Engineering meets Product Engineering in capital projects” and “Plant Information Management - What to manage?”
​
As the last post dwelled on how EPC’s and product companies are trying to promote re-use in very Engineer To Order (ETO) intensive projects, we will focus on the handover to supply chain and logistics in this post.

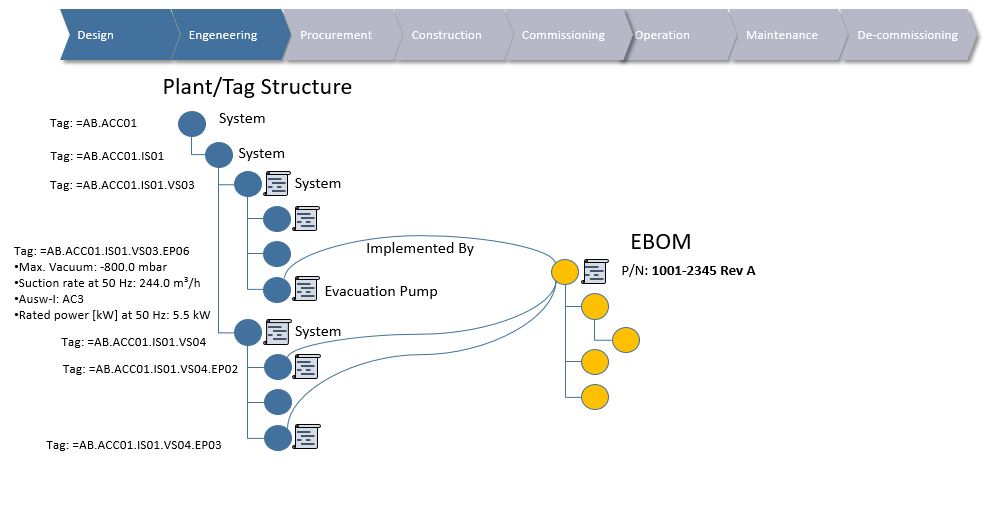
The relationship between the tag containing the project specific requirements, and the article or part containing the generic product design constitutes a project specific demand that supply chain and logistics should know about. If both the tag and the connected part is released, a “signal” is sent with information regarding both the tag’s requirements and the part’s requirements.
​An exception to this rule is typically Long Lead Items (LLI). I’ve seen this handled via a special process that allows transfer of the information to supply chain and logistics even if the specific tag has not been released.
Picture
Figure 1.
As the project specific information regarding all three tags and the intended use of product design is sent to logistics and supply chain it is possible to distinguish what tags need special attention and what tags can be ordered “off the shelf”.

Let’s say that tag: =AB.ACC01.IS01.VS04.EP03 is in a safety classed area and the other two are not. Information in the purchase order for the safety classed tag must then contain information to the manufacturer that documentation regarding the manufacturing process must follow the produced individual that will be used to implement this specific tag, whereas the other two deliveries can have standard documentation.
​
Picture
Figure 2.
Figure 2 depicts that all three manufactured products or physical items with serial numbers come from the same Engineering Bill Of Material, but that the individual with serial number S/N: AL11234-12-15 has some extra information attached.
This is because since it is to be used in a safety classed environment, proof must be produced from the manufacturer’s side that the product fulfills the safety class requirements given on the tag. This could for instance be X-Ray documentation that all welds are up to spec or that the alloy used has sufficient quality.
As you can see, If the information is kept as information structures with relationships between the different data sets detailing what context the different information is used in, it becomes possible to trace and manage it all in project specific processes.
There are some other very important information structures that I mentioned in the post “Plant Information Management - What to manage?” like the Sales BOM (similar to manufacturing industries Manufacturing BOM), the Supply BOM and warehouse management, however I would like to cover those in more detail later in later posts.
​
For now let’s follow the journey of the manufactured products as they move into installation and commissioning.


Picture
Figure 3.
Provided that the information from the different structures and their context in relation to each other is kept, it is possible to trace perfectly what physical items should be installed where, corresponding to the tag requirements in the project (note: I’ve removed the connections from tag to EBOM in this figure for clarity).

We are now able to connect the information from tag: =AB.ACC01.IS01.VS04.EP03, the one in the safety classed area, to the physical item with serial number S/N: AL11234-12-15 that contains the documentation proving that it is fit for purpose in a safety classed area.
As the other two tags are not in a safety classed area, and have no special requirements, any of the two physical pumps can be used to fulfill the tag requirements, however we still want full traceability for commissioning, operations & maintenance.
​
Picture
Figure 4
Since we now have a connection between the tag requirements and the physically installed individuals, we can commence with various commissioning tests and verify that what we actually installed works as intended in relation to what we designed (the plant system), and furthermore we can associate certificates and commissioning documentation to the physical individuals.
The reason for this split between tag object and physical item object I’d like to come back to in a future post regarding operations and maintenance.

Bjorn Fidjeland


The header image used in this post is by Nostal6ie and purchased at dreamstime.com
1 Comment

PLM - the KPI's, the ROI and the simple

8/20/2016

0 Comments

 
Picture
It is often hard to measure since PLM affects so many different and interchanging aspects of an engineering and manufacturing company.

​However I would like to share a story about a multi-billion dollar company who was about to embark on a global PLM implementation journey.
They were required to come up with a series of KPI’s and to report the progress to top management. The PLM project spent considerable effort in doing so.
One of the 10 KPI’s they identified was their engineering change process. They measured time spent from the engineering change was requested to it was released, and furthermore the impact it had on the project execution schedules in their customer projects (The company is heavily engaged in project intensive industries).

All measurements were done on a monthly basis before and after the PLM platform went live.

Before the introduction of the platform it was largely a manual process where the project and product managers would gather and have so called “sign fests” where engineering changes was simply signed without much review since the magnitude of changes was staggering, and so they had to rely on the judgement of their junior managers. This sounds like a rather risky approach, but the fact was that the cost of not approving was far greater than just approving. Needless to say this manual process still took quite some time since the junior managers spent a lot of time evaluating before submitting to the “sign fest”.

After the introduction of the PLM platform, they continued measuring. Top management was still eager to get reports on all the KPI’s, but then they started to notice something. The engineering change process showed a relatively modest drop in time spent globally in the beginning, but the calculation of impact on time and money saved in the projects showed impressive results. As the organization got more and more familiar with the new engineering change process, the time spent from change request to release fell rapidly, and the result in ongoing customer projects was even greater.

After less than a year they concluded that the improvements on throughput of Engineering Changes and time spent on them alone paid for the entire project.
​
In my view, yes there are a lot of important benefits like “increased collaboration” using a PLM platform that are hard to measure, but a lot of times it makes even more sense to measure smaller but more identifiable benefits and then trace the impact they have further down the lifecycle of the product.

Bjorn Fidjeland

The header image used in this post is by Andrewgenn and purchased at dreamstime.com


0 Comments
<<Previous

    plmPartner
    This is where we share our thoughts, ideas and experiences with you

    RSS Feed

    View my profile on LinkedIn

    Categories

    All
    AEC
    BIM
    Data Management
    Digital Twin
    ERP
    Facility Lifecycle Management
    Integration
    Internet Of Things
    IOT
    Platform
    PLM
    Process
    Product Lifecycle Management
    Strategy
    Structured Data
    Technical Information Management
    VDC
    Virtual Design And Construction

Contact us:
plmPartner AS    Lyngfjellveien 14    4580 Lyngdal    Norway    +47 99 03 05 19    info@plmpartner.com