Follow us at
plmPartner
  • Home
  • About
  • Blog
  • Archive
  • Contact
  • Video Log
  • Learning Center
  • Privacy Policy

Opportunities and strategies - Product Configuration Lifecycle Management

4/25/2021

0 Comments

 
Picture

This time an article that aims towards the more traditional Product Lifecycle Management domain and especially towards configurable products or so called Configure To Order (CTO) products. This article is a direct result of discussions I’ve had with Henrik Hulgaard, the CTO of Configit, on Configuration Management in general and Product Configuration Management in particular. Configit specializes in Product Configuration Management, or as they prefer to call it Configuration Lifecycle Management.
 
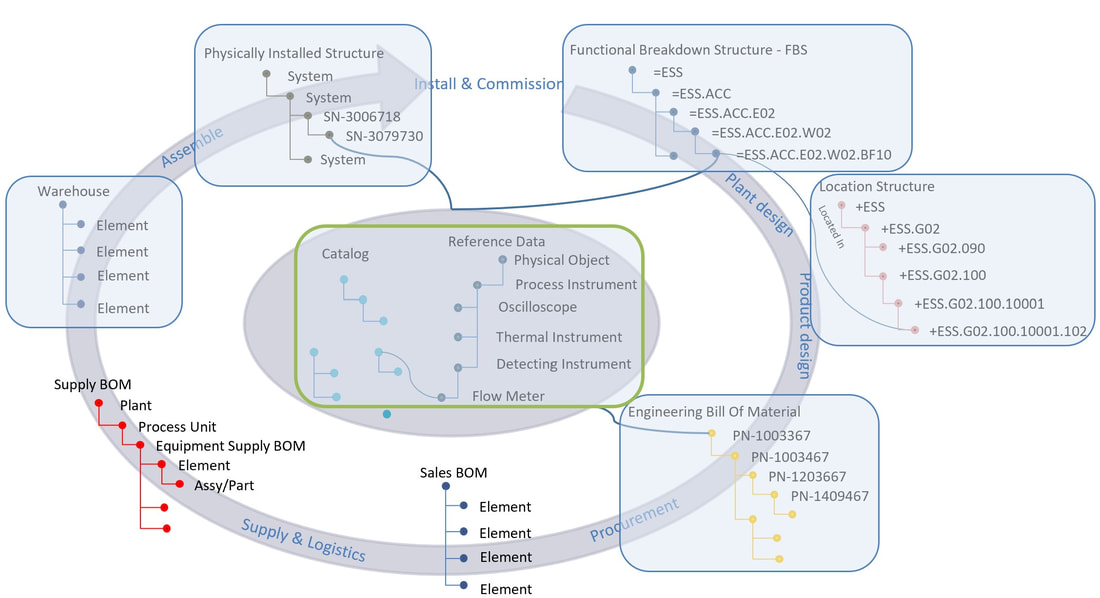
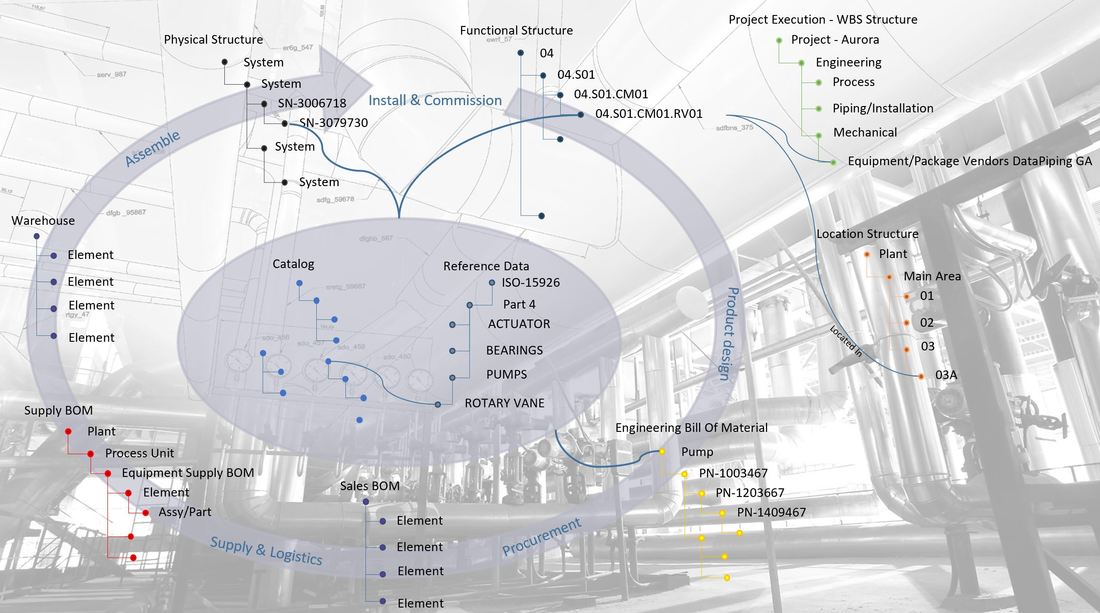
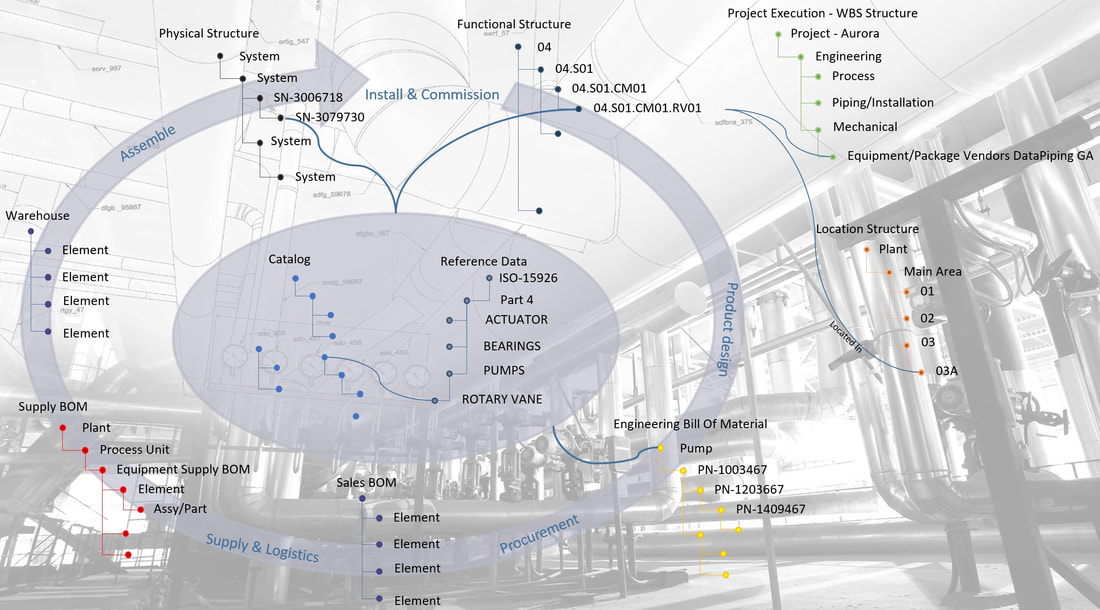
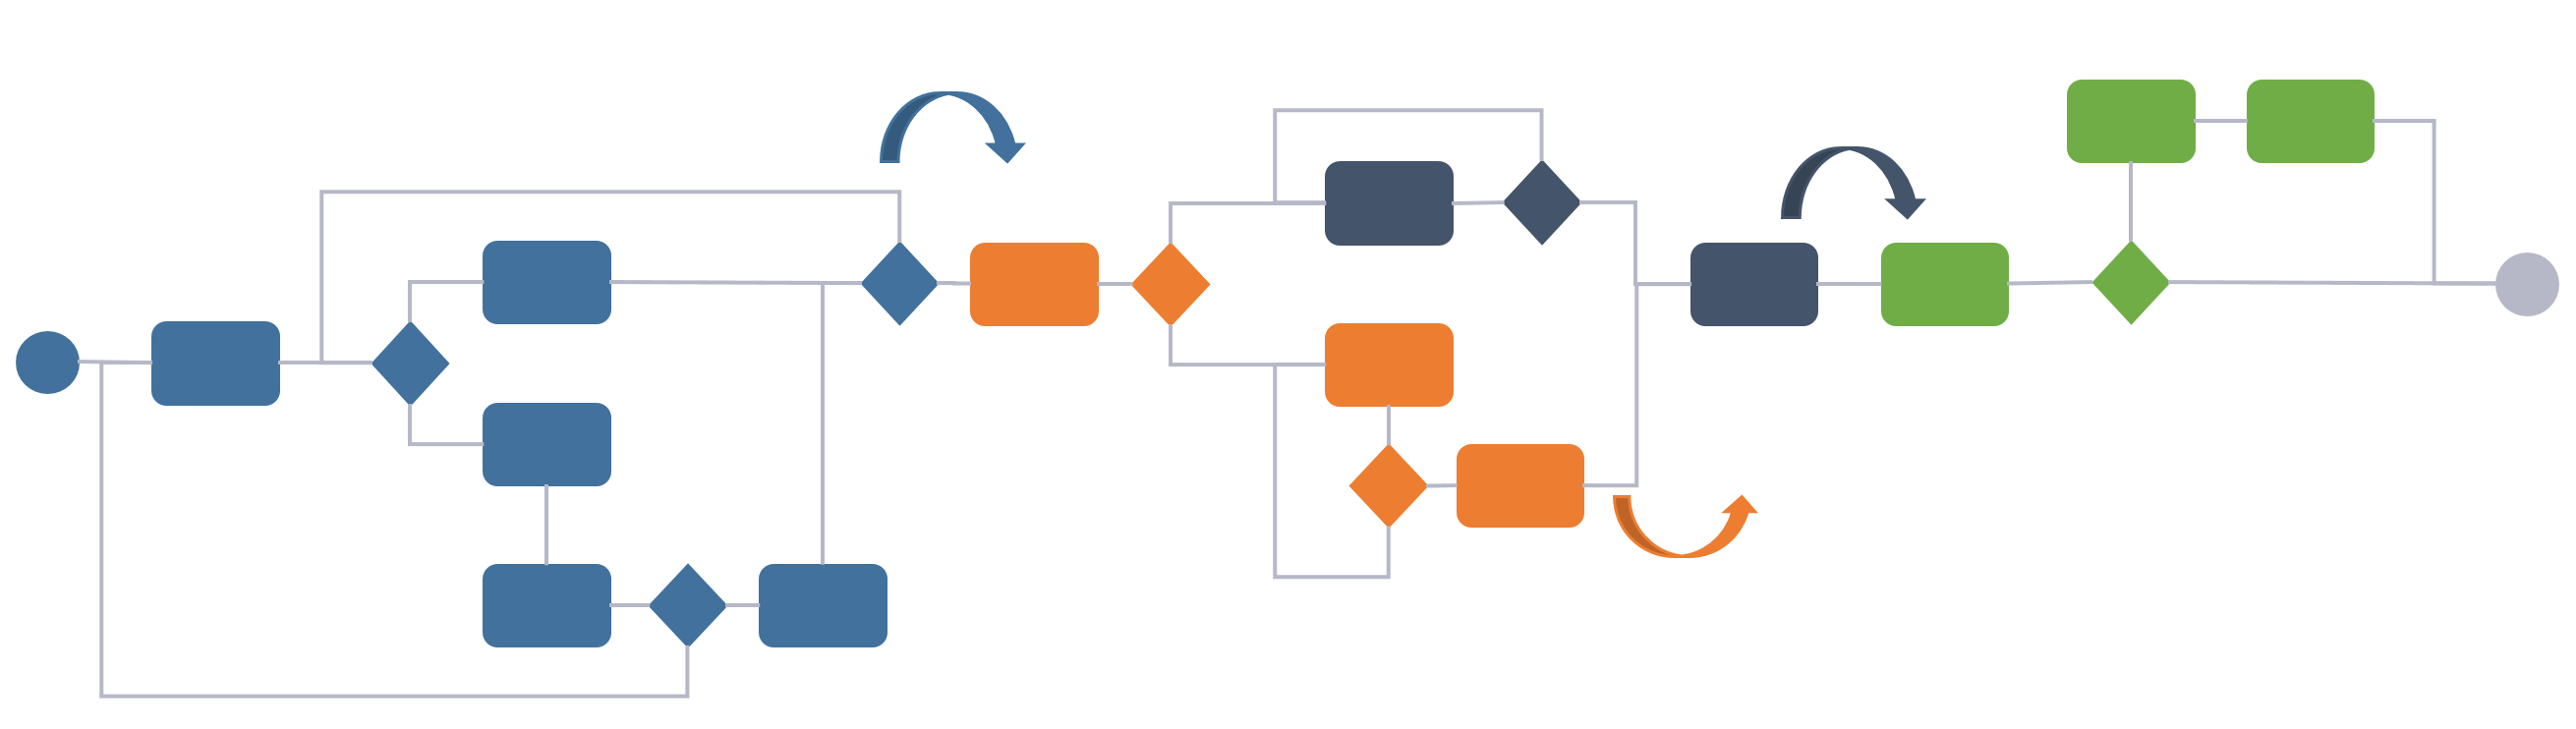
Most businesses that design, manufacture and sell products have a system landscape in place to support key areas during the lifecycle of a product pretty much as in the image below (there are of course differences from company to company).
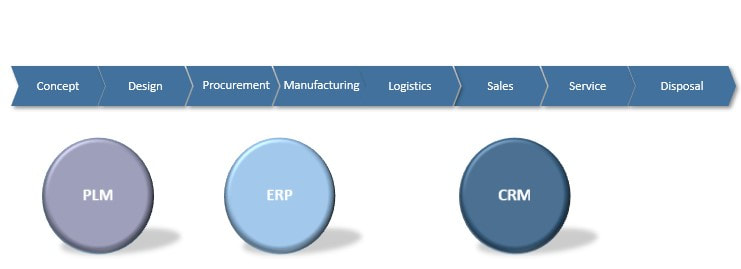
​
Picture
Figure 1.

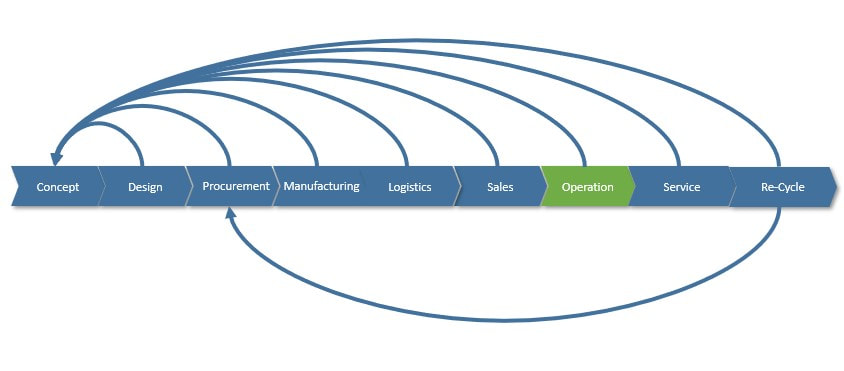
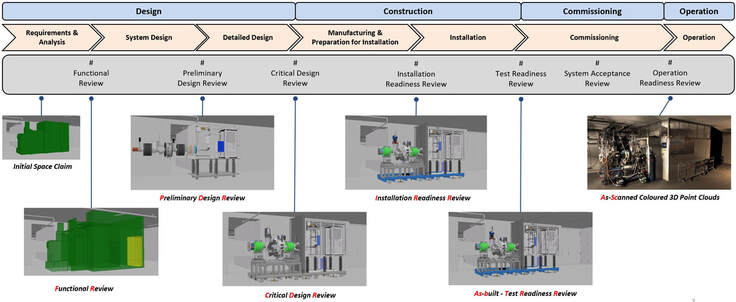
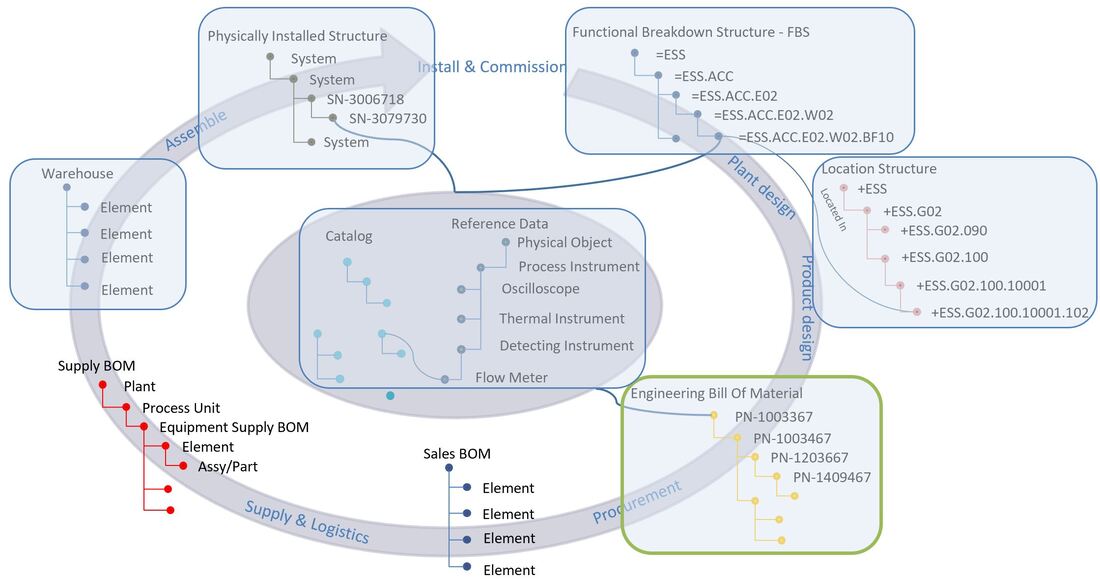
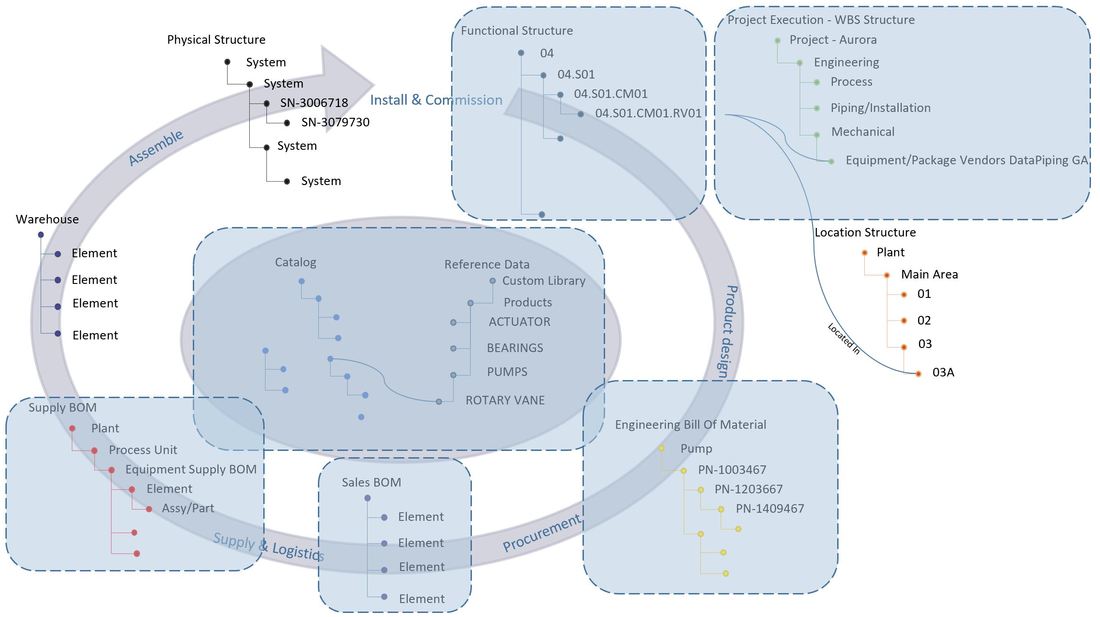
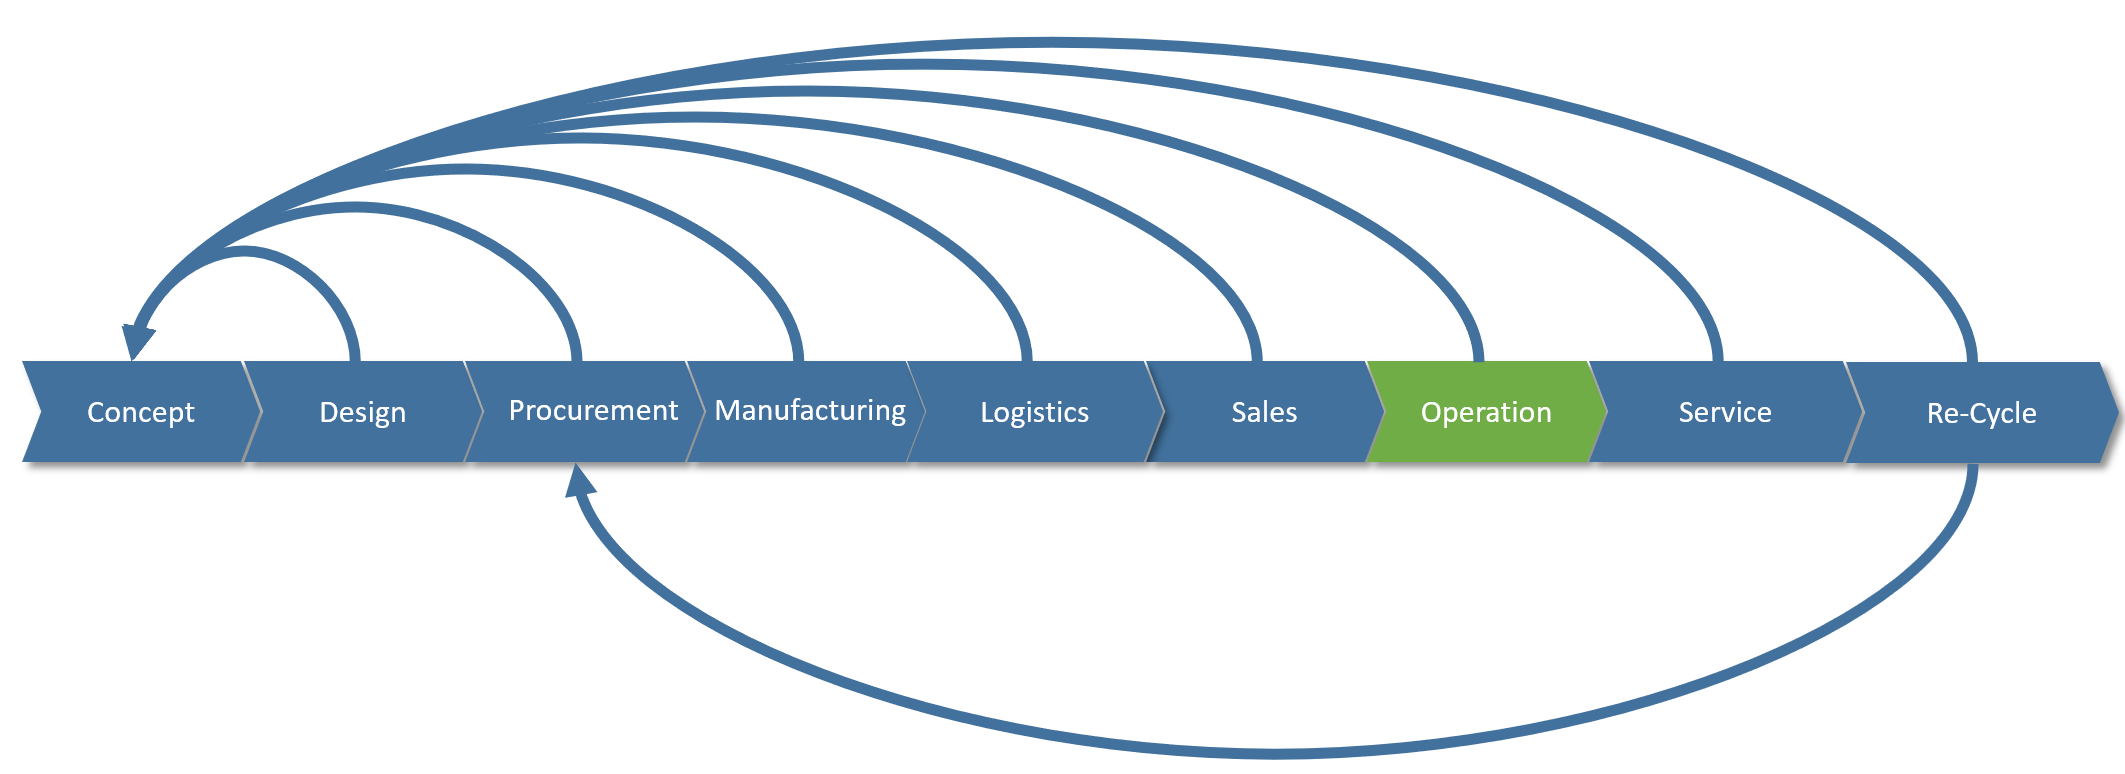
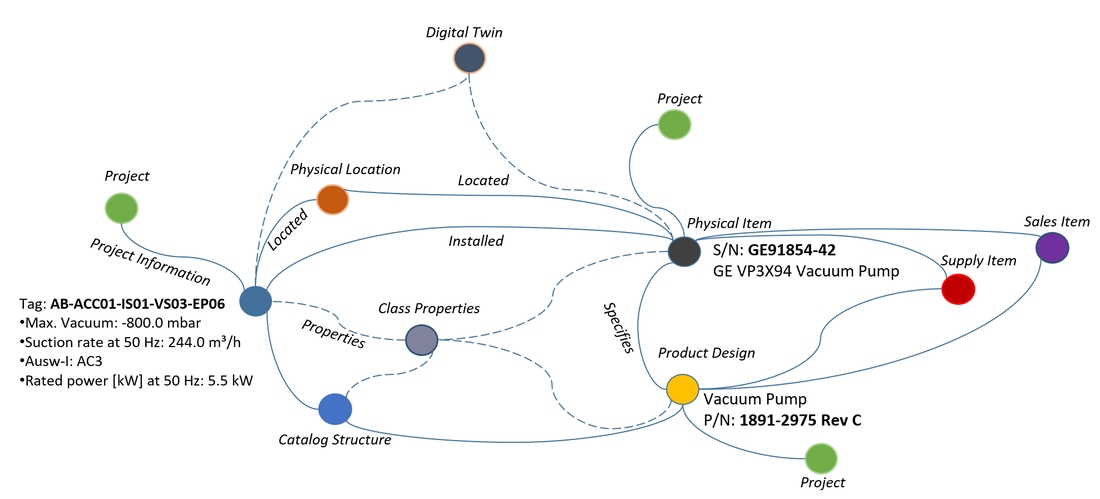
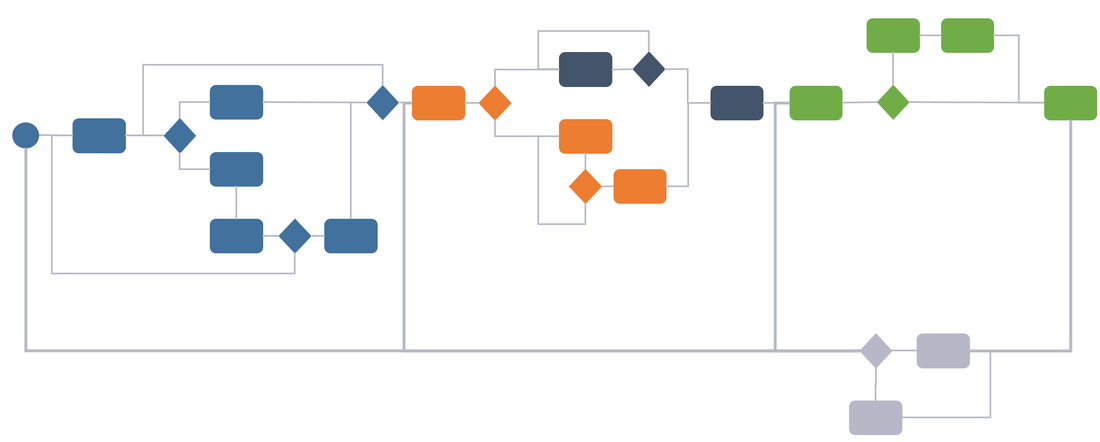
This works well as long as the product lifecycle is linear, like it has mostly been in the past. However, as more and more companies strive after being able to let customers “personalize” their products, (so, to configure them to support their individual personal needs), harvest data and behavior from “the field” through sensors to detect trends in usage as well as being able to offer new services while the product is in use (operational), the lifecycle cannot be linear anymore in my view. This is because all phases of the lifecycle need feedback and information from the other phases to some degree. You may call this “a digital thread”, “digital twin” or “digital continuity” if you will (figure 2).
Picture
Figure 2.

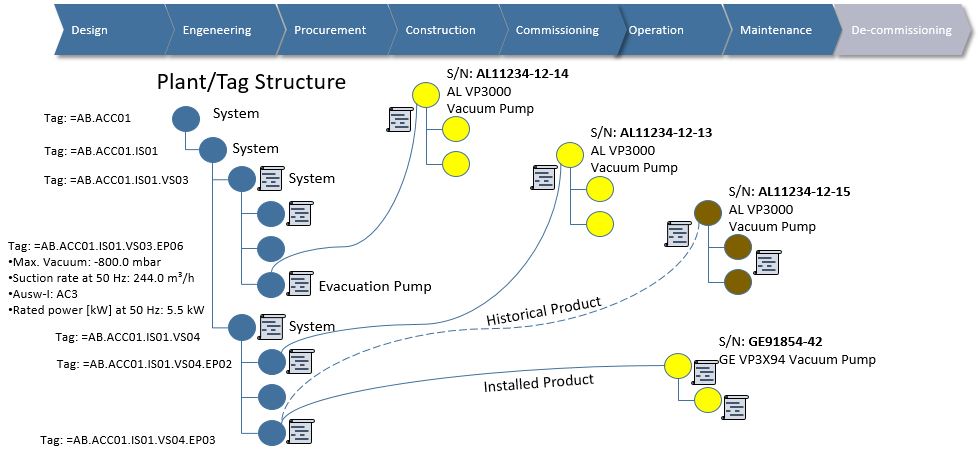
Such a shift puts enormous requirements on traceability and change management of data all the way from how the product was designed, through to how it is used, how it is serviced and ultimately how it is recycled. If the product is highly configurable, the number of variants of the product that can be sold and used is downright staggering.
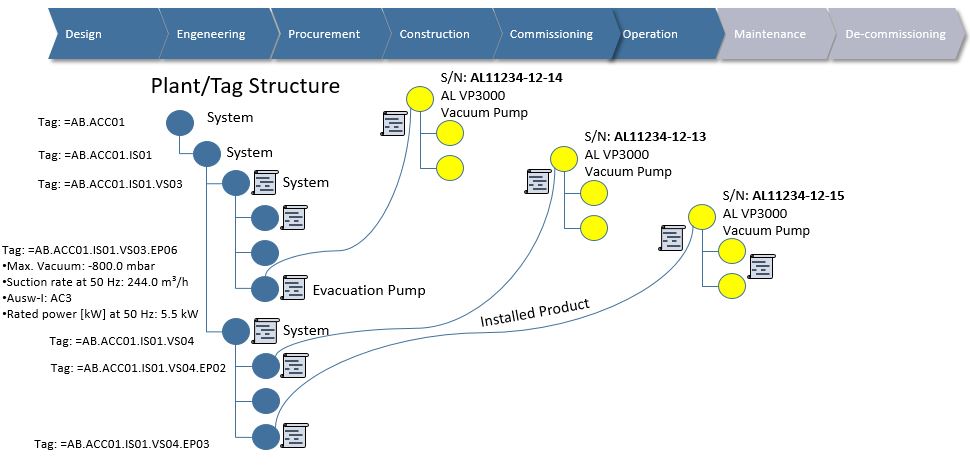
Needless to say, it will be difficult to offer a customer good service if you do not know what variant of the product the customer has purchased, and how that particular instance of the product has been maintained or upgraded in the past.
 
So, what can a company do to address these challenges and also the vast opportunities that such feedback loops offer?

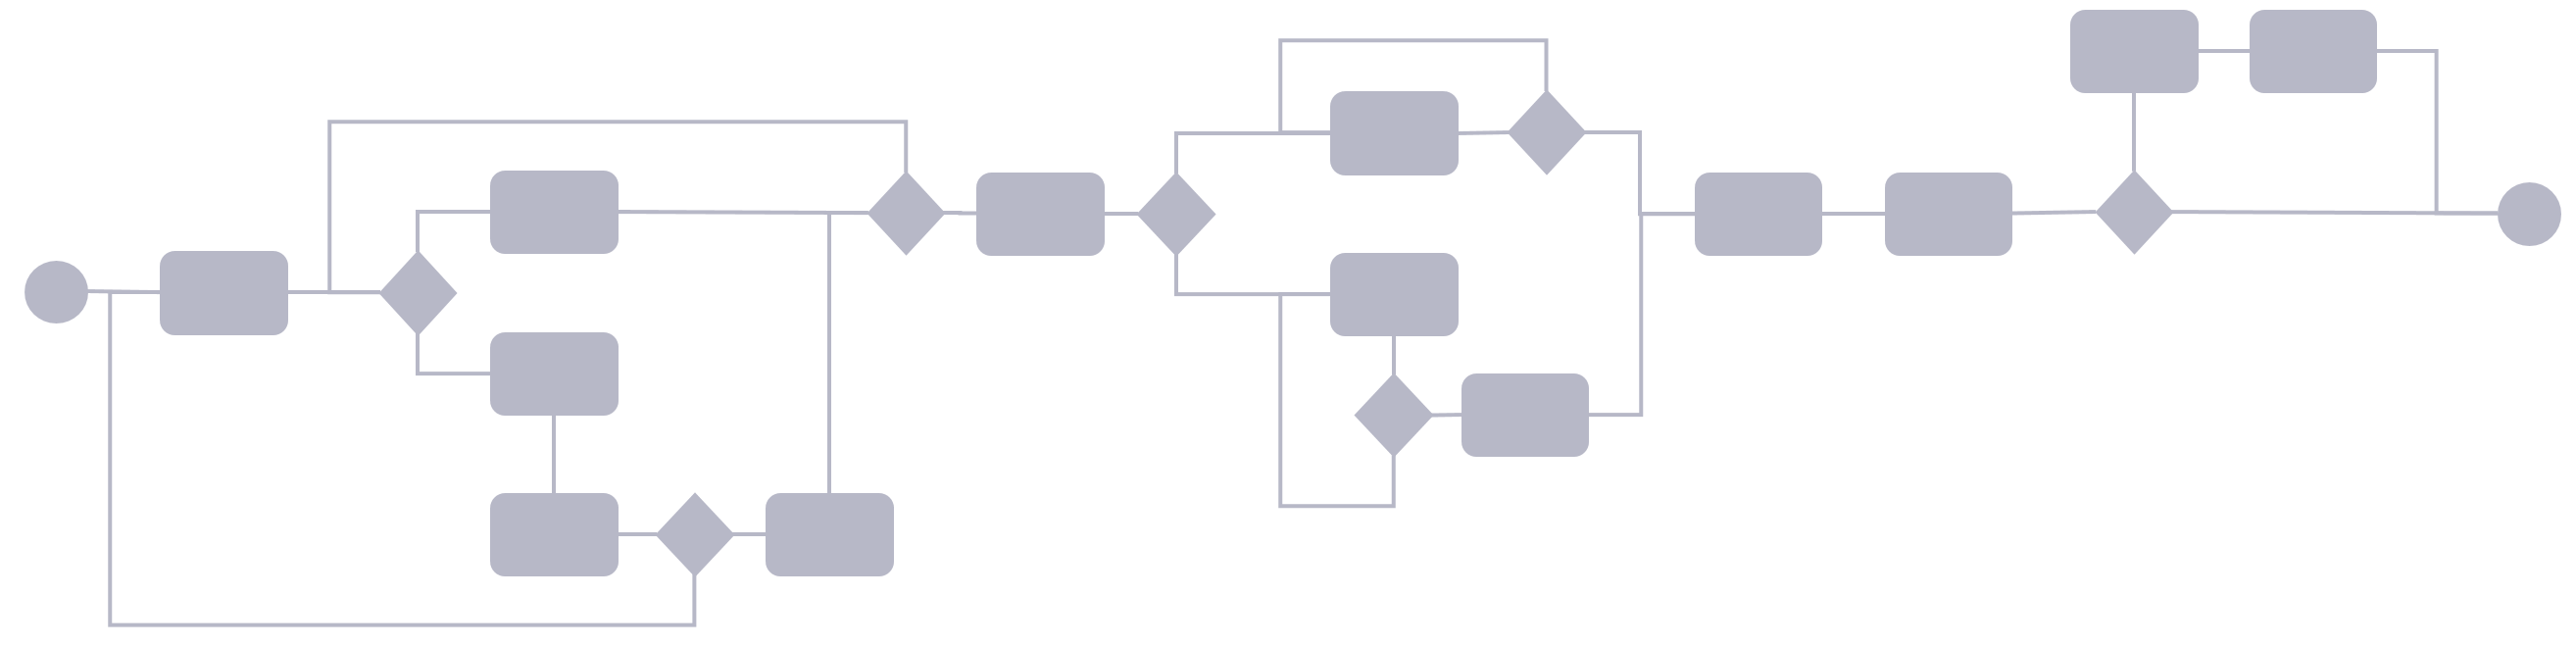
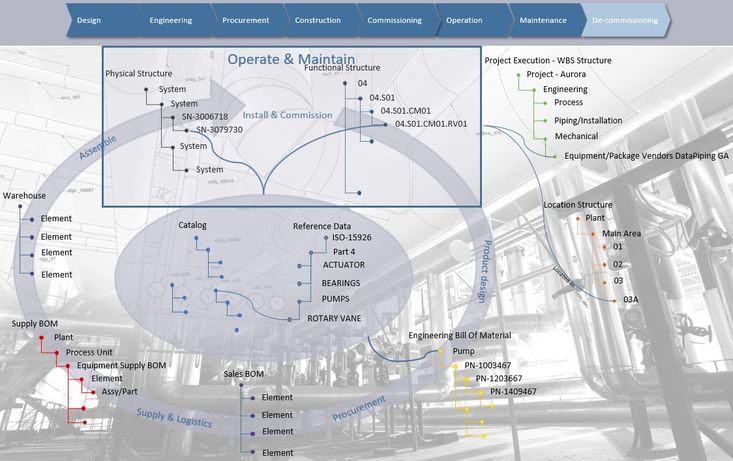
If we consider the three system domains that are normally present (there are often more), they are more often than not quite siloed. That is in my experience not because the systems cannot be integrated, but more as a result of organizations still working quite silo oriented (Figure 3).
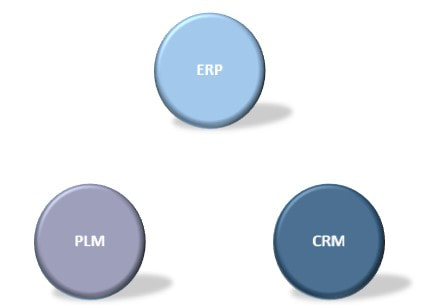
​


Picture
Figure 3.

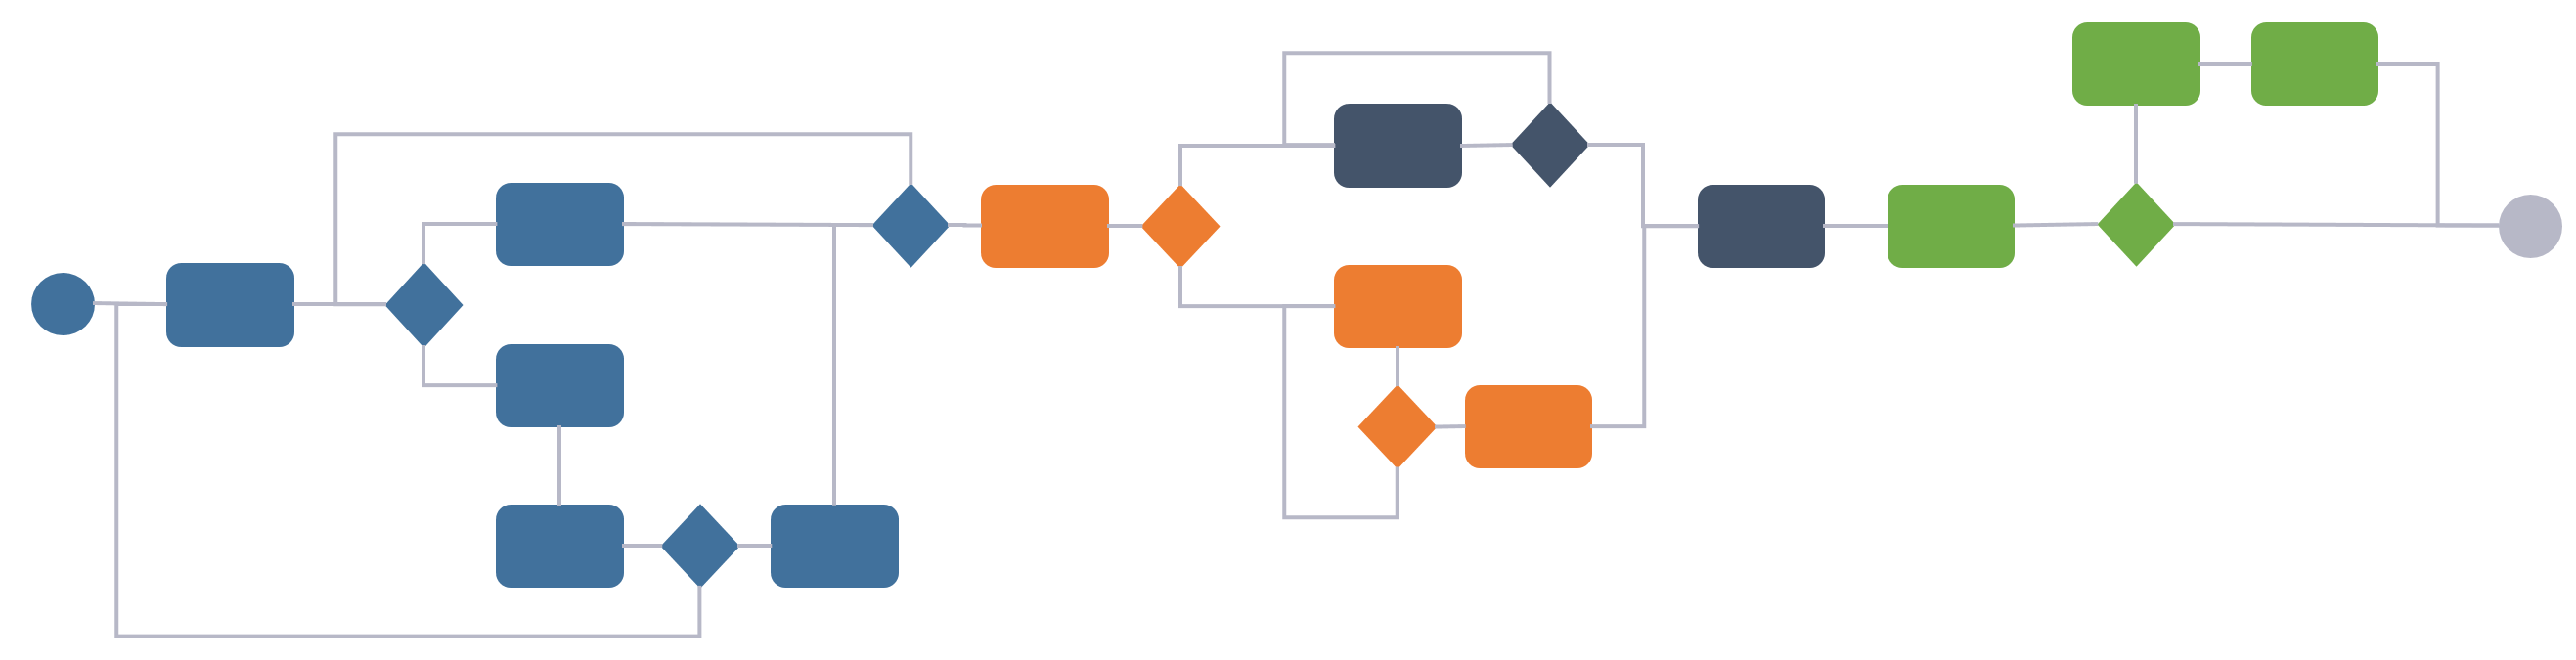
All companies I’ve worked with wants to break down these silos and internally become more transparent and agile, but what domain should take on the responsibility to manage the different aspects of product configuration data? I mean, there is the design & engineering aspect, the procurement aspect, the manufacturing aspect, the sales aspect, the usage/operation aspect, the service/maintained aspect and ultimately the recycling aspect.
 
Several PLM systems today have configuration management capabilities, and it would for many companies make sense to at least manage product engineering configurations here, but where do you stop? I mean, sooner or later you will have to evaluate if more transactional oriented data should be incorporated in the PLM platform which is not a PLM system’s strongpoint (figure 4).
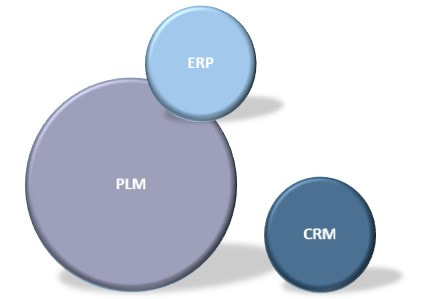
Picture
Figure 4.

On the other hand, several ERP systems also offer forms of configuration management either as an addition or as part of their offering. The same question needs to be answered here. Where does it make most sense to stop as ERP systems are transactional oriented, while PLM systems are a lot more process and iteratively work oriented (figure 5).
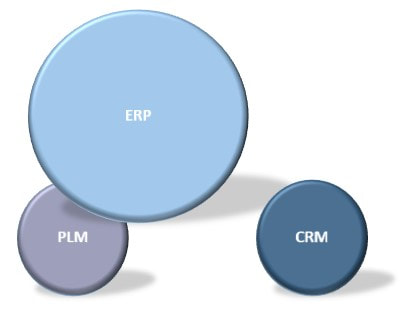

Picture
Figure 5.

The same questions need to be asked and answered for the scenario regarding CRM. Where does it make sense to draw the boundaries towards ERP or PLM, like in figure 6.
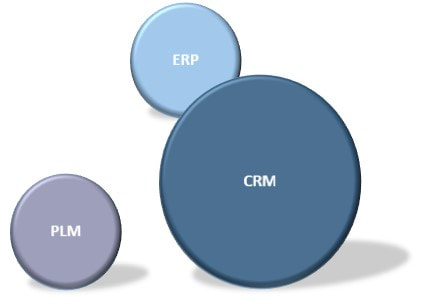
​
Picture
Figure 6.

I have seen examples of companies wanting to address all aspect with a single software vendor’s portfolio, but in my experience, it only masks the same questions within the same portfolio of software solutions. Because, who does what, where and with responsibility for what type of data when, is not tackled by using a single vendor’s software. Those are organizational, and work process related questions, not software questions.
 
Another possible solution is to utilize what ERP, PLM and CRP systems are good at in their respective domains, and implement the adjoining business processes there. Full Product Configuration Management or Configuration Lifecycle Management needs aspects of data from all the other domains to effectively manage the full product configuration, so a more domain specific Configuration Management platform could be introduced.
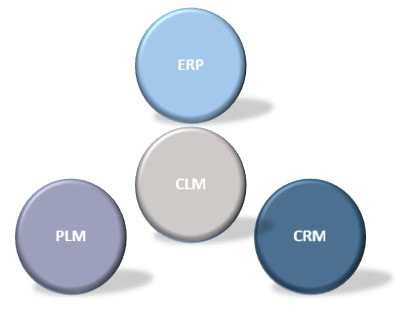

Picture
Figure 7.

Such a platform will have to be able to reconcile information from the other platforms and tie it together correctly, hence it would need a form of dictionary to do that. In addition, it needs to define or at least master the ruleset defining what information from PLM can go together with what information in ERP and CRM to form a valid product configuration that can legally be sold in the customer’s region.

As an example, consider: What product design variant that meets the customer requirements can be manufactured most cost effectively and nearest the customer with the minimal use of resources and still fulfill regulatory requirements in that customers country or region?
These are some of the questions that must be answered.

More strategic reasons to evaluate a setup like in figure 7 could be:
  • As the departmental silos in an organization is often closely linked to the software platform domain, it might be easier to ensure collaboration and acceptance by key stakeholders across the organization with a “cross-cutting” platform that thrives on quality information supplied by the other platforms.
  • It poses an opportunity for companies with a strategy of not putting too many eggs in the basket of one particular software system vendor.
  • It could foster quality control of information coming from each of the other domains as such a CLM solution is utterly dependent on the quality of information from the other systems.
  • Disconnects in the information from the different aspects can be easily identified.

I would very much like to hear your thoughts on this subject.
​
Bjorn Fidjeland 


​The header image used in this post is by plmPartner
0 Comments

PLM Tales from a true mega project ch. 7 - Reference Data

2/28/2020

0 Comments

 
Picture
Image courtesy of European Spallation Source ERIC

In previous chapters we’ve discussed the different data and information structures that needs to be in place in order to support a capital facilities project like the European Spallation Source from engineering through operations, maintenance and ultimately decommissioning.
Structured data is excellent, but wouldn’t it be even better to also have aligned definitions across data-structures and tools?
It certainly would, so in this chapter we’re going to look into what has been done at ESS to achieve interoperability across both data structures and software tools.
​
If you would like to read previous chapters first before we take a deeper dive, you can find them all here:
Archive
​
​
Picture
The figure above shows that Tag’s, Parts (in EBOM’s) and Installed Assets all use the same reference data library to obtain class names and attributes, meaning that a centrifugal pump is called exactly that across all structures as well as in different authoring tools, the PLM system and the Enterprise Asset Management system. Furthermore, they share the same attribute names and definitions including unit of measures.
​
Several years ago, it was decided to use ISO 15926 as a reference data library. We were able to obtain an export of the RDL (Reference Data Library) by the excellent help of then POSC Caesar Services and imported ISO 15926 part 4 into the PLM platform. Easy right? Well, not quite. We discovered that we now had more than 7000 classes beautifully structured and about 1700 attributes. However, none of the attributes were assigned to the main classes as the attributes were all defined as sub classes of a class called property.

​
Picture
Figure 2. Image courtesy of European Spallation Source ERIC

Figure 2 shows a small portion of the reference data library.
What this in essence meant was that you could select a class to be used for a Tag, Part or an Asset and it would be clear that it was a Choke Valve across all entities, but the entities would not have any attributes defined.
​
The solution to this problem was to form a cross discipline reference data group whose mandate is to assign needed attributes for ESS to the classes. It was soon discovered that the standard did not contain everything needed to describe a research facility, so the group also received a mandate to define new classes and attributes whenever needed. The reference data group met every week for the first two years, but now, it meets every second week.
The group is also tasked with defining letter codes for all classes to be used at ESS according to the standard ISO 81346 which is the chosen tagging standard.

​After every meeting any new classes, attributes and letter codes are deployed to the master reference data library in the PLM platform. The library serves as a common data contract across tags, parts and assets meaning that every entity get the same set of attributes and more importantly, identical names and definitions. This is also enforced across different software tools, rendering integration between the tools a lot easier as the need for complex mapping files disappears.

​
Picture
Figure 3. Image courtesy of European Spallation Source ERIC

Figure 3 shows some of the attributes that have been associated to the class Valve. As the PLM platform supports inheritance of attributes in class libraries, special care is taken with respect to adding attributes at an appropriate level so that the attributes are valid for all sub classes.
​
Picture
Figure 4. Image courtesy of European Spallation Source ERIC

Figure 4 is from the functional breakdown structure where some of the functional objects (tags) are listed. Please note the classification column indicating which class from the reference data library has been used to define attributes to each specific tag.
​
Picture
Figure 5. Image courtesy of European Spallation Source ERIC
​
Let’s examine one of the tags a bit closer. Figure 5 shows some of the attributes for the specific pressure transmitter selected (but without production data).
The same kind of information is available on any part selected to realize the tag requirements and ultimately on the delivered asset itself that was installed in the facility to fulfill the tag’s requirements.

The challenges described in this article are of course not unique to ESS, and several companies have done similar exercises or defined their own proprietary master data. The problem with all of them is that it becomes reference data libraries that are unique to a specific project or for one company only and thereby not solving interoperability problems between companies participating in the value chain of a capital facilities project.

I’m happy to see that initiatives like CFIHOS (Capital Facilities Information HandOver Specification, now that’s a tongue twister) seems promising and are worth checking out for anybody thinking about embarking on a similar journey, however for ESS it was never an option as we needed usable reference data fast.

It is my hope that this article can serve as inspiration for other companies as well as software vendors. I also want to express my gratitude to the European Spallation Source and to Peter Rådahl, Head of Engineering and Integration department in particular for allowing me to share this with you.

Bjorn Fidjeland
0 Comments

PLM tales from a true megaproject ch. 5 - Spatial Integration

9/20/2019

0 Comments

 
Picture
Image courtesy of ESS Spatial Integration Team

In the past chapters I’ve talked an awful lot about structured data and information structures, and yes, in my view this is very important as it is the very essence to obtain effective Plant Lifecycle Management, however in this chapter let’s take breather from the data structures and have a look at how ESS manages the aspect of space management (which is also a structure….. Of course I almost hear you say, but it looks a lot shinier, and by the way, yes it is connected to the tag structure (FBS) and the other information structures).

At ESS there is a team headed by Fabien Rey, responsible for Spatial Integration which includes an all discipline 3D master-model called the EPL (ESS Plant Layout) of the entire facility.
​
So, what is this Spatial Integration?
​
It is defined as configuration management of the space available. This means that everything that is designed and that will go into the facility and will occupy space, must have received an initial space claim which is then refined throughout the engineering process. This is true for all disciplines from conventional building, machine systems, product engineering, plant & process to electrical.
Picture
Image courtesy of ESS Spatial Integration Team

When examining the EPL from afar, it looks pretty much like what you would expect from any architectural model, but when focusing on the machine aspects in the facility it gets more interesting, however as ESS is a huge facility, so, still not much detail
Picture
Image courtesy of ESS Spatial Integration Team

Let’s zoom in on the tiny little area at the bottom right corner, which is where the proton beam starts its journey towards the target to create spallation of neutrons.
Picture
Image courtesy of ESS Spatial Integration Team

Here we get a taste for the enormous level of detail we are talking about.
The person to the right is to get a feel for the scale. This picture only shows the first few meters of the 650-meter-long accelerator.
The image is from the Virtual Reality room at ESS. The VR room is used for several different purposes, but among them, multi-discipline reviews for everything from design to installation and commissioning activities.
​
​Let's look the other way
Picture
Image courtesy of ESS Spatial Integration Team

The next picture is taken, not from the  VR room, but still the same EPL.
This time from a different software with a slightly different purpose. What is unique in my experience is that it is the same model, under configuration control, loaded into different environments for different purposes.
Picture
Image courtesy of Piero Valente, Group Leader Plant & Process at European Spallation Source ERIC
 
So how does ESS control all of this from a process point of view?
​
If you look at the picture below, you’ll see the actual engineering process (high level) together with the evolution of a space claim and refinement of design space, or rather the space allocation.
Picture
Image courtesy of ESS Spatial Integration

BUT WAIT!

Why does the process continue from as-designed into as-built and as-scanned??
​
Well, I never said that the EPL was purely design space configuration management. ESS has taken it a huge step forward to also incorporate, not only as built models, but rather As-Scanned models as well, which means there is a huge infrastructure in place to secure detailed 3D scans that can be imported into the EPL and put as an “overlay” to the design model like in the picture of the models below.
Picture
Image courtesy of ESS Spatial Integration Team

In such a model, inaccuracies between design model and actually installed becomes painfully apparent. I choose this image because I wanted to commend the extreme accuracy of this piping section, however there are numerous examples where errors have been caught which would have posed problems for other installation disciplines afterwards. Early correction of such mistakes is vital to avoid cascading effects for installation, and therefore scans are performed regularly and compared with the design model.

Below you can see an example of an As-Scanned Colored 3D Point Cloud only…. Remember the pipe from the previous picture….
Picture
Image courtesy of ESS Spatial Integration Team

As we have now visually seen design requirements compared to actually installed, from a spatial integration perspective, I will show the same for tag requirements and installed physical assets in the next chapter. I know I promised this in the last chapter, but I could not resist showing it from a spatial integration perspective first.

It is my hope that this article can serve as inspiration for other companies as well as software vendors. I also want to express my gratitude to the European Spallation Source and to Peter Rådahl, Head of Engineering and Integration department in particular for allowing me to share this with you.
​
Bjorn Fidjeland
0 Comments

PLM tales from a true megaproject Ch. 4

6/20/2019

0 Comments

 
Picture
Image courtesy of European Spallation Source ERIC

In chapter four we will enter familiar and traditional PLM territory as we will take a closer look at product designs and EBOM’s (Engineering Bill Of Materials). European Spallation Source face the complexities of pure Engineer To Order (ETO) which means that they will only manufacture one of the designed products in the facility, as well as product designs that will be manufactured in series.
It is important to note that some of the products going into the facility was not even invented at the time the decision was made to build the European Spallation Source.

If you would like to read the previous chapters first before we take a deeper dive, you can find them here:
PLM tales from a true megaproject Ch. 1
PLM tales from a true megaproject Ch. 2 – Functional Breakdown Structure
PLM tales from a true megaproject Ch. 3 – Location Breakdown Structure

If you’d like to familiarize yourself more with the concepts of the different structures, please visit:
Plant Information Management - Information Structures


Picture
Figure 1.

As the management of product designs and their data is the home turf of any PLM system (Product Lifecycle Management), this area of the plant PLM platform has been left as much out of the box as possible, but I’ll go through some examples all the same.
The EBOM consists of Parts ordered in a hierarchical structure usually largely defined by mechanical product engineering and their design model. The structure is in itself multidiscipline, meaning that it contains mechanical parts, electrical parts and sometimes parts representing other things like drops of glue, software etc.
Based on an EBOM, one or many products can be manufactured. In other words, it is generic in nature.

​
Picture
Figure 2. Image courtesy of European Spallation Source ERIC

The image above is from the plant PLM system and shows a simple EBOM which we can see is released. So what does released mean? Well It means that it is ready seen from the product engineering aspect. Such a released product design can be selected to fulfill one or many functional locations (tags) in the overall facility, as we discussed in chapter 1.
A part is specified by a specification, so it has specifying documentation connected in the form of a 3D model, a drawing or a document

​
Picture
Figure 3. Image courtesy of European Spallation Source ERIC

In our example in figure 3 there is a 3D model associated, which is specifying the mechanical aspects of the part (note: I have masked owner and released date).
In order to release a part and ultimately an EBOM consisting of parts, a few PLM principles must be observed. Specifying information must always be released prior to the release of the part. So bottom up.
The same is true for the EBOM. Child parts must be released before the parent part can be released. (this is the opposite of the release of the functional structure, but we’ll discuss that in a later chapter)


To govern the release process, a Change Order is used (in PLM also referred to as ECO or Engineering Change Order). In many serial manufacturing companies, it is common to have a process prior to deciding if a change should be implemented. This is because they want to make very sure that they understand all possible impacts a design change might have before they manufacture millions of their products based on the new design.
Such a process, in PLM often referred to as ECR or Engineering Change Request, is omitted at ESS, however the same analysis is performed early on in the change order process.
The release process is one of the areas where ESS have deviated from the out of the box solution in order to streamline as much as possible for their needs.
Let’s have a look at the process with another example.
 
​
Picture
Figure 4. Image courtesy of European Spallation Source ERIC

Figure 4 shows an EBOM structure used for training at ESS (It is not an ESS design, but merely an example I’ve created in their plant PLM system). Please observe that the EBOM of this plug valve contains a few parts, is three levels deep and is currently in a lifecycle state called In Work (there are more lifecycle states than showed in the images of this article). All Parts and specifications have individual lifecycle states.
​​
Picture
Figure 5. Image courtesy of European Spallation Source ERIC

The image above is seen from the Change Order governing the move of both parts and specifications through their lifecycle states. We can see at the top left of the image that the CO (Change Order) is in “In Work” state. I’ve chosen to let one CO be responsible for the release of the full EBOM and all associated specifications, but I could have split the responsibility across multiple CO’s if I’d wanted to.
In figure 5 we can also see that all parts and their specifications are in state Approved. This means that the responsible engineering discipline feels that they are ready and have done their part of the work

​​
Picture
Figure 6. Image courtesy of European Spallation Source ERIC

The last stretch of the release process is to move all the parts and their specifications from the Approved state to the Released state.
A workflow with electronic signatures is responsible for doing this. The workflow above states that Bjorn Fidjeland… (Yes, me) is responsible for reviewing the entire EBOM and all specifications. In a real live process, the members of a CDR (Critical Design Review) are listed as reviewers, and one or more final approvers assumes responsibility for the release. At ESS the CDR is a multi-discipline review with both internal and external stakeholders.
Normally it is not allowed to have the same person as both reviewer and approver, but since I’ve got admin rights to this environment, and did not want to show the names of ESS reviewers and approvers, the example is as it is.

When the last person in the workflow sequence has approved, all specifications and parts governed by the Change Order are automatically promoted from Approved state to Released state, and the Change Order itself is marked complete. The system itself takes care of the bottom up release rules of the EBOM.

​
Picture
Figure 7. Image courtesy of European Spallation Source ERIC

Figure 7 shows the fully released EBOM, including all specifications governed by this one Change Order.

The next chapter will be about how ESS manages information about their physical assets, how physically installed assets are linked to the facility’s tag requirements in the Functional Breakdown Structure, where they are located in the Location Breakdown Structure and from what product design they originate from.

It is my hope that this article can serve as inspiration for other companies as well as software vendors.
I also want to express my gratitude to the European Spallation Source and to Peter Rådahl, Head of Engineering and Integration department in particular for allowing me to share this with you.
​
Bjorn Fidjeland
0 Comments

PLM Benchmark 3 – EPC 2  What did they do and why?

8/2/2018

1 Comment

 
Picture
This is an article in the series regarding PLM benchmarking among operators, EPC’s and product companies.
The articles cover the motivation for doing as they did, and where their main focus was put in order to achieve their goals.

I will continue to use my information structure map, or the “circle of life” as a client jokingly called it, to explain where the different companies put their focus in terms of information management and why.
Picture
​EPC 2 had a slightly different focus from the EPC in my previous article as they were in an industry where there is a less clear split between Engineering Procurement and Construction companies and Product companies in the capital project value chain.
This company had the challenges of both EPC’s and product companies in ETO (Engineer To Order) projects as they owned several product companies, and naturally used a lot of their products in their EPC projects.
​
Picture
Figure 2 shows the different data structures that EPC 2 focused on

Their first objective was to respond to fearsome competition from other parts of the world who suddenly emerged on the global scene. In order to do so it was considered crucial to limit the amount of engineering hours used to gain projects. To achieve this, they decided to build a catalog of re-usable data structures with different perspectives (plant, product, execution) in order to promote a controlled re-use of both plant and product engineering data. Similarly, as for EPC 1 they recognized that standardization across disciplines would be necessary to make it all work. The reference/master data put in place for all disciplines to share was a proprietary company standard.

Secondly, they needed to replace a homegrown engineering data hub. This homegrown solution was very impressive indeed and contained a lot of functionality that commercial systems lack even today, however its architecture was built around processes that did no longer work as EPC 2 entered new markets.

Thirdly they wanted to connect their plant engineering disciplines with the various product engineering disciplines throughout their own product companies worldwide. Naturally this meant run-time sharing and consolidation of data on a large scale. The emergence of the catalog with different aspects meant that plant engineering could pick systems and products from the catalog and have auto generated project specific tag information in the functional structure of their projects. It also meant that product engineering would be able to either generate a unique Engineer To Order bill of material if needed, or if plant engineering had not done any major modifications, link it to an already existing Engineering Bill of Material for the full product definition. 
​
Their fourth objective was to obtain full traceability of changes across both plant and product engineering disciplines from FEED (Front End Engineering & Design) to delivered project. The reason for this objective was twofold. One part was to be able to prove to clients (operators) where changes originated from (largely from the client itself), and secondly to be able to measure what changes originated from their own engineering disciplines without project planning and execution knowing about it….. Does it sound familiar?
In order to achieve this, engineering data change management was enforced on both FEED functional design structures (yes, there could be several different design options for a project) and the functional structure in the actually executed EPC project. The agreed FEED functional structure was even locked and copied to serve as the starting point for the EPC project. At this point all data in the functional structure was released, subjected to full change management (meaning traceable Change Orders would be needed to change it) and made available to project planning and execution via integration.
Picture
Figure 3 shows the sequence of data structures that was focused on in the implementation project.

Since product design and delivery was a large portion of their projects, the Engineering Bill of Material (EBOM) and variant management (the catalog structures) got a lot more focus compared with EPC 1 in my previous article. This was natural because, as mentioned, EPC 2 owned product companies and wanted to make a shift from Engineer To Order (ETO) towards more Configure To Order (CTO).
It was however decided to defer the catalog structures towards the end because they wanted to gain experience across the other aspects as well before starting to create the catalog itself.


The Functional Structure with the consolidated plant design, project specific data and associated documentation was out next together with the establishment of structures for project execution (WBS), estimation and control (Sales structure), and logistics (Supply structure).

Once the various data structures were in place, the focus was turned to “gluing it all together” with the re-usable catalog structures and the reference data which enabled interoperability across disciplines.

A more comprehensive overview explaining the different structures can be found in the article:
Plant Information Management - Information Structures, and further details regarding each information structure are discussed in:
Plant Engineering meets Product Engineering in capital projects
Handover to logistics and supply chain in capital projects
Plant Information Management - Installation and Commissioning
Plant Information Management – Operations and Maintenance

​Bjorn Fidjeland


The header image used in this post is by 8vfand and purchased at dreamstime.com
1 Comment

Big Data and PLM, what’s the connection?

1/3/2018

3 Comments

 
Picture
I was challenged the other day to explain the connection between Big Data and PLM by a former colleague. The connection might not be immediately apparent if your viewpoint is from traditional Product Lifecycle Management systems which primarily has to do with managing the design and engineering data of a product or plant/facility.

However, if we first take a look at a definition of Product Lifecycle Management from Wikipedia:

“In industry, product lifecycle management (PLM) is the process of managing the entire lifecycle of a product from inception, through engineering design and manufacture, to service and disposal of manufactured products. PLM integrates people, data, processes and business systems and provides a product information backbone for companies and their extended enterprise.”
​
Traditionally it has looked much like this
Picture
Then let’s look at a definition of Big Data
​

“Big data is data sets that are so voluminous and complex that traditional data processing application software are inadequate to deal with them. Big data challenges include capturing data, data storage, data analysis, search, sharing, transfer, visualization, querying, updating and information privacy. There are three dimensions to big data known as Volume, Variety and Velocity.
Lately, the term "big data" tends to refer to the use of predictive analytics, user behavior analytics, or certain other advanced data analytics methods that extract value from data, and seldom to a particular size of data set. "There is little doubt that the quantities of data now available are indeed large, but that’s not the most relevant characteristic of this new data ecosystem." Analysis of data sets can find new correlations to "spot business trends, prevent diseases, combat crime and so on.”

Included in Big Data you’ll find data sets harvested from sensors within all sorts of equipment and products as well as data fed back from software running within products. One can say that a portion of Big Data is the resulting feedback from the Internet of Things. Data in itself is not of any value whatsoever, but if the data can be analyzed to reveal meaning, trends or knowledge about how a product is used by different customer segments then it has tremendous value to product manufacturers.
If we take a look at the operational phase of a product, and by that, I mean everything that happens from manufactured product to disposal, then any manufacturer would like to get their hands on such data, either to improve the product itself or sell services associated with it. Such services could be anything from utilizing the product as a platform for an ecosystem of connected products to new business models where the product itself is not the key but rather the service it provides. You might sell guaranteed uptime or availability provided that the customer also buys into your service program for instance.

 
The resulting analysis of the data should in my view be managed by, or at least serve as input to the product definition because the knowledge gleamed from all the analytics of Big Data sets ultimately impacts the product definition itself since it should lead to revised product designs that fulfills the customer needs better. It might also lead to the revelation that it would be better to split a product in two different designs going after two distinct end user behavior categories found as a result of data analysis from the operational phase of the products.
​
Connected products, Big Data and analysis will to a far greater extent than before allow us to do the following instead:
Picture
It will mean that experience throughout the full lifecycle can be made available to develop better products, tailor to new end user behavior trends and create new business models.

Note: the image above focuses on the feedback loops to product engineering, but such feedback loops should also be made available from for instance service and operation to manufacturing.

Most companies I work with tell me that the feedback loops described in the image above is either too poor, or virtually nonexistent. Furthermore, they all say that such feedback loops are becoming vital for their survival as more and more of their revenue comes from services after a product sale and not from the product sale itself. This means that it is imperative for them to have as much reliable and analyzed data as possible about their products performance in the field, how their customers are actually using them and how they are maintained.

For these companies at least, the connection between Big Data analysis and its impact on Product Lifecycle Management is becoming clearer and clearer.


Bjorn Fidjeland


The header image used in this post is by garrykillian and purchased at dreamstime.com

3 Comments

Digital Twin - What needs to be under the hood?

10/22/2017

0 Comments

 
Picture
In the article Plant Information Management – Information Structures, and the following posts regarding Plant Information Management (see Archive) I explained in more detail the various information structures, the importance of structuring the data as object structures with interconnecting relationships to create context between the different information sources. 

​What does all of this have to do with the digital twin? - Let's have a look.

Picture
​Information structures and their interconnecting relationships can be described by one of the major fashion word these days, the digital thread or digital twin.
The term and concept of a digital twin was first coined by Michael Grieves at the University of Michigan in 2002, but has since taken on a life of its own in different companies.
 
Below is an example of what information can be accessed from a digital twin or rather what the digital twin can serve as an entry point for:
Picture
​If your data is structured in such a way with connected objects, attributes and properties, an associated three-dimensional representation of the physically delivered instance is a tremendously valuable asset as a carrier of information. It is however, not a pre- requisite that it is a 3D model, a simple dashboard giving access to the individual physical items might be enough. The 3D stuff is always promoted in the glossy sales representations by various companies, but it’s not needed for every possible use case. In a plant or aircraft, it makes a lot of sense, since the volume of information and number of possible entry points to the full data set is staggering, but it might not be necessary to have individual three-dimensional representations for all mobile phones ever sold. It might suffice to have each data set associated with each serial number.
 
On the other hand, if you have a 3D representation, it can become a front end used by end users for finding, searching and analyzing all connected information from the data structures described in my previous blog posts. Such insights takes us to a whole new level of understanding of each delivered products life, their challenges and opportunities in different environments and the way they are actually being used by end customers.
 
Let’s say that we via the digital twin in the figure above select a pump. The tag of that pump uniquely identifies the functional location in the facility. An end user can pull information from the system the pump belongs to in the form of a parametric Piping & Instrumentation Diagram (P&ID), the functional specification for the pump in the designed system, information about the actually installed pump with serial number, manufacturing information, supplier, certificates, performed installation & commissioning procedures and actual operational data of the pump itself.
 
The real power in the operational phase becomes evident when operational data is associated with each delivered pump. In such a case the operational data can be compared with environmental conditions the physical equipment operates in. Let’s say that the fluid being pumped contains more and more sediments, and our historical records of similar conditions tells us that the pump will likely fail during the next ten days due to wear and tear of critical components. However, it is also indicated that if we reduce the power by 5 percent we will be able to operate the full system until the next scheduled maintenance window in 15 days. Information like that gives real business value in terms of increased uptime.
 
Let’s look at some other possibilities.
If we now consider a full facility with a three-dimensional representation:
During the EPC phase it is possible to associate the 3D model with a fourth dimension, time, turning it into a 4D model. By doing so, the model can be used to analyze and validate different installation execution plans, or monitor the actual ongoing installation of the Facility. We can actually see the individual parts of the model appearing as time progresses.
 
A fifth dimension can also be added, namely cost. Here the cost development over time according to one or several proposed installation execution plans or the actual installation itself can be analyzed or monitored.
This is already being done by some early movers in the construction industry where it is referred to as 5D or Virtual Design & Construction.
 
The model can also serve as an important asset when planning and coordinating space claims made by different disciplines during the design as well as during the actual installation. It can easily give visual feedback if there is a conflict between space claims made by electrical engineering and mechanical engineering, or if there is a conflict in the installation execution plan in terms of planned access by different working crews.
More and more companies are also making use of laser scanning in order to get an accurate 3D model of what has been actually installed so far. This model can easily be compared with the design model to see if there are any deviations. If deviations are found, they can be acted upon by analyzing how it will impact the overall system if it is left as it is, or will it require re-design? Does the decision to leave it as it is change the performance of the overall system? Are we still able to perform the rest of the installation, due to less available space?
Answers to these questions might entail that we will have to dismantle the parts of the system that has deviations. It is however a lot better and cost effective to identify such problems as early as possible.
 
This is just great, right? Such insights as mentioned would have huge impacts on how EPC’s manage their projects, operators run their plants and how product vendors can operate or service their equipment in the field, as well as feeding information back to engineering to make better products.
​
​New business models can be created in the likes of: “We sell power by the hour, dear customer, you don’t even have to buy the asset itself”!
(Power-by-the-Hour is a trademark of Rolls-Royce, although the concept itself is 50 years old you can read about a more recent development here)
 
So why haven’t more companies already done it?
 
Because in order to get there, the underlying data must be connected, and in the form of… yes data as in objects, attributes and relationships. It requires a massive shift from document orientation to connected data orientation to be at its most effective.
 
On the bright side, several companies in very diverse industries have started this journey, and some are already starting to harvest the fruits of their adventure.
​
My advice to any company thinking about doing the same would be along the lines of:
When eating this particular elephant, do it one bite at the time, remember to swallow and let your organization digest between each bite.

Bjorn Fidjeland

The header image used in this post is by Elnur and purchased at dreamstime.com

​
0 Comments

Who owns what data when…..?

7/7/2017

0 Comments

 
Picture
​A vital questions when looking at cross departmental process optimization and integration is in my view: who owns what data when in the overall process? 
Picture
Usually this question will spark up quite a discussion between the process owners, company departments, data owners and the different enterprise architects. The main reason for this is that depending on where the stakeholders have their main investment, they tend to look at “their” part of the process as the most important and the “master” for their data.

Just think about sales with their product configurators, engineering with CAD/PLM, supply chain, manufacturing & logistics with ERP and MES. Further along the lifecycle you encounter operations and service with EAM, Enterprise Asset Management, systems sometimes including MRO, Maintenance Repair and Operations/Overhaul. The last part being for products in operational use. Operations and service is really on the move right now due to the ability to receive valuable feedback from all products used in the field (commonly referred to as Internet of Things) even for consumer products, but hold your horses on the last one just for a little while.
​
The different departments and process owners will typically have claimed ownership of their particular parts of the process, making it look something like this:
Picture
This would typically be a traditional linear product engineering, manufacturing and distribution process. Each department has also selected IT tools that suit their particular needs in the process.
This in turn leads to information handovers both between company departments and IT tools, and due to the complexity of IT system integration, usually, as little as possible of data is handed from one system to the next.
​
So far it has been quite straight forward to answer “who owns what data”, especially for the data that is actually created in the departments own IT system, however, the tricky one is the when in “ who owns what data when”, because the when implies that ownership of certain data is transferred from one department and/or IT system to the next one in the process. In a traditional linear one, such information would be “hurled over the wall” like this:
Picture
Now, since as little information as possible flowed from one department / IT system to the next, each department would make it work as best as they could, and create or re-create information in their own system for everything that did not come directly through integration.
Only in cases where there were really big problems with lacking or clearly faulty data, an initiative would be launched to look at the process and any system integrations that would be affected.

The end result being that the accumulated information throughout the process that can be associated with the end product, that is to say the physical product sold to the consumer, is only a fraction of the actual sum of information generated in the different department’s processes and systems.
​
Now what happens when operations & services get more and more detailed information from each individual product in the field, and starts feeding that information back to the various departments and systems in the process?
Picture
The process will cease to be a linear one, it becomes circular with constant feedback of analyzed information flowing back to the different departments and IT systems.

Well what’s the problem you might ask.

The first thing that becomes clear is that each department with their systems does not have enough information to make effective use of all the information coming from operations, because they each have a quite limited set of data concerning mainly their discipline.

Secondly, the feedback loop is potentially constant or near real-time which will open up for completely new service offerings, however, the current process and infrastructure going from design through engineering and manufacturing was never built to tackle this kind of speed and agility.

Ironically, from a Product Lifecycle Management perspective, we’ve been talking about breaking down information and departmental silos in companies to utilize the L in PLM for as long as I can remember, however the way it looks now, it is probably going to be operations and the enablement of Internet Of Things and Big Data analytics that will force companies to go from strictly linear to circular processes.

And when you ultimately do, please always ask yourself “who should own what data when”, because ownership of data is not synonymous with the creation of data. Ownership is transferred along the process and accumulates to a full data set of the physically manufactured product until it is handed back again as a result of fault in the product or possible optimization opportunities for the product.

 – And it will happen faster and faster
​
Bjorn Fidjeland


The header image used in this post is by Bacho12345 and purchased at dreamstime.com
0 Comments

Plant Information Management – Operations and Maintenance

1/29/2017

0 Comments

 
Picture
This post is a continuation of the posts in the Plant Information Management series of:
“Plant Information Management - Installation and Commissioning”
“Handover to logistics and supply chain in capital projects”
“Plant Engineering meets Product Engineering in capital projects”
 “Plant Information Management - What to manage?”

During operations and maintenance, the two main structures of information needed in order to operate the plant in a safe and reliable manner is the functional or tag structure and the physically installed structure.
The functional tag structure is a multidiscipline consolidated view of all design requirements and criteria, whereas the physically installed structure is a representation of what was actually installed and commissioned together with associated data. It is important to note that the physically installed structure evolves over time during operations and maintenance, so it is vital to make baselines of both structures together to obtain “As-Installed” and “As-Commissioned” documentation
​
Picture
Figure 1.
​

Let’s zoom in on some of the typical use cases of the two structures.
Picture
Figure 2.
​

The requirements in the blue tag structure are fulfilled by the physical installation, the yellow structures. In a previous post I promised to get back to why they are represented as separate objects. The reason for this is that during operations one would often like to replace a physical individual on site with another physical individual. This new physical individual still has to fulfill the tag requirements, as the tag requirements (system design) have not changed. In addition we need full traceability of not only what is currently installed, but also what used to be installed at that functional location (see figure 3).
Picture
Figure 3.

Here we have replaced the vacuum pump during operations with another vacuum pump from another vendor. The new vacuum pump must comply with the same functional requirements as the old one even if they might have different product designs.
This is a very common use case where a product manufacturing company comes up with a new design a few years later. The product might be a lot cheaper and still fulfills the requirements, so if the operator of the plant has 500 instances of such products in the facility, it makes perfect sense to replace them when the old product nears end of life or have extensive maintenance programs.
 
Another very important reason to keep the tag requirements and physically installed as separate objects is if….or rather when the operator wishes to execute a modification or extension project to the plant.
In such cases one must still manage and record the day to day operation of the plant (work requests and work orders performed on physical equipment in the plant) while at the same time performing a plant design and execution project. This entails Design, Engineering, Procurement, Construction and Commissioning all over again.
Picture
Figure 4.
​

The figure shows, that when the blue functional tag structure is kept separate from the yellow physically installed structure we can still operate the current plant on a day to day basis, and at the same time perform new design on the revised system (Revision B).
This allows us to execute all the processes right up until commissioning on the new revision, and when successfully commissioned, the revision B becomes operational.
​
This all sounds very good in theory, but in practice it is a bit more challenging, as there in the meantime might have been made change orders that effected the design of the previous revision as a result of operations. This is one of the use cases where structured or linked data instead of a document centric approach really pays off, because such a change order would immediately indicate that it would affect the new design, and thus,  appropriate measures can be taken at an early stage instead of nasty surprises popping up during installation and commissioning of the new system.

Bjorn Fidjeland

The header image used in this post is by nightman1965 and purchased at dreamstime.com
0 Comments

Plant Engineering meets Product Engineering in capital projects

9/30/2016

0 Comments

 
Picture
This post is a follow up of “Plant Information Management - What to manage?”.

It focuses on the needed collaboration between Plant Engineering (highly project intensive) and Product Engineering which ideally should be “off the shelf” or at least Configure To Order (CTO), but in reality is more often than not, Engineer To Order (ETO) or one-offs.

More and more EPC’s (Engineering Procurement Construction companies), and product companies exposed to project intensive industries are focusing hard on ways to  re-use product designs from one project to the next or even internally in the same project through various forms of configuration and clever use of master data, see “Engineering Master Data - Why is it different?”.
​
However, we will never get away from the fact that the product delivery in a capital project will always have to fulfill specific requirements from Plant Engineering, and especially in safety classed areas of the plant.
If you look at the blue object structure, it represents a consolidated view of multi-discipline plant engineering. The system might consist of several pumps, heat exchangers, sensors, instrumentation and pipes, but we are going to focus on a specific tag and it’s requirements, namely one of the pumps in the system.​
Picture
At one point in the plant engineering process the design is deemed fit for project procurement to start investigating product designs that might fulfill the requirements stated in the plant system design.
If the plant design is made by an EPC that does not own any product companies, the representing product is typically a single article or part with associated preferred vendors/manufacturers who might be able to produce such a product or have it in stock. If the EPC does own product companies, the representing product might be a full product design. In other words a full Engineering Bill Of Material (EBOM) of the product.
 
This is where it becomes very interesting indeed because the product design (EBOM) is generic in nature. It represents a blueprint or mold if you will, used to produce many physical products or instances of the product design. The physical products typically have serial numbers, and you are able to touch them. However, due to requirements from the Owner/Operator, the EPC will very often dictate both project and tag specific documentation from the product company supplying to the project, which in turn often leads to replication of the product designs X number of times to achieve compliance with the documentation requirements in the project (Documentation For Installation and Operations).
​
Picture
So, even if it is exactly the same product design it ends up being copied each time there is a project specific delivery. This often happens even if let’s say 40 pumps are being supplied by the same vendor to the same project, as responses to the requirements on 40 different tags in the plant design……
Needless to say it becomes a lot of Engineering Bill Of Materials in order to comply with documentation requirements in capital projects. Even worse, for the product companies it becomes virtually impossible to determine exactly what they have delivered each time, since it is different Engineering Bills Of Materials all the time, yet 97% of the information might be the same. The standardized product has now become an Engineer To Order product.
So how is it possible to avoid this monstrous duplication of work?
More and more companies are looking into ways to make use of data structures used in different contexts. The contexts might be different deliveries to the same project or across multiple projects, but if one is able to identify and separate the generic information from what information that needs to be project specific it is also possible to facilitate re-use.
​
Picture
​The image above shows how a generic product design (EBOM) is able to fulfill three different project specific tags or functional locations in a plant. Naturally three physical instances or serial numbers must then be manufactured based on the generic product design, but since we have the link or relationship between the project specific requirements (the tags) and the generic (the EBOM), one can generate project specific data and documentation without making changes to the generic representation of the product (the EBOM).
This approach even enables the product company to identify and manufacture one of the pumps which happens to be in a safety classed area in the plant design according to regulatory requirements without having to make changes or duplicate the product design, however more on that next time.
 
Bjorn Fidjeland


The header image used in this post is by Nostal6ie and purchased at dreamstime.com
0 Comments
<<Previous

    plmPartner

    This is where we share our thoughts, ideas and experiences with you

    RSS Feed

    View my profile on LinkedIn

    Categories

    All
    AEC
    BIM
    Data Management
    Digital Twin
    ERP
    Facility Lifecycle Management
    Integration
    Internet Of Things
    IOT
    Platform
    PLM
    Process
    Product Lifecycle Management
    Strategy
    Structured Data
    Technical Information Management
    VDC
    Virtual Design And Construction

Contact us:
plmPartner AS    Lyngfjellveien 14    4580 Lyngdal    Norway    +47 99 03 05 19    info@plmpartner.com