
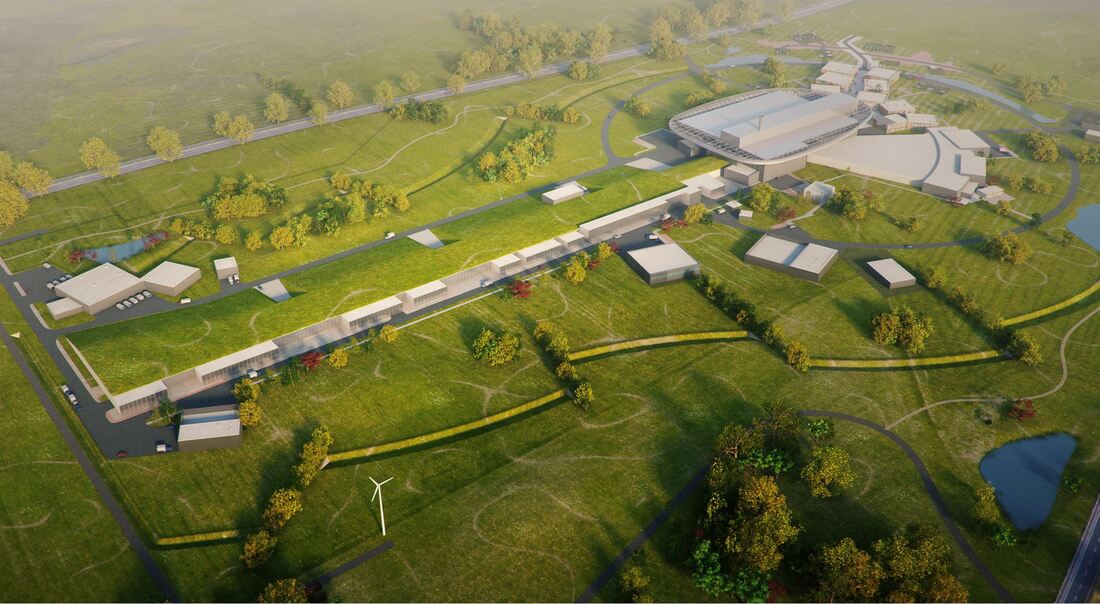
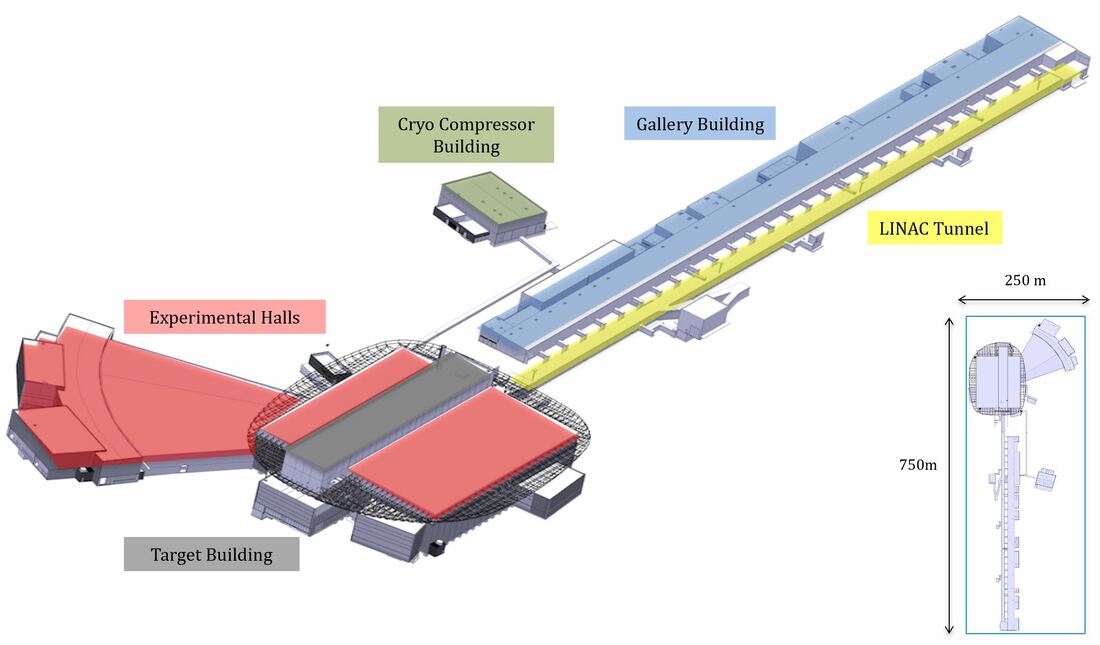
Image courtesy of European Spallation Source ERIC
In this chapter we are going to take a look at how the location breakdown structure is implemented at the European Spallation Source.
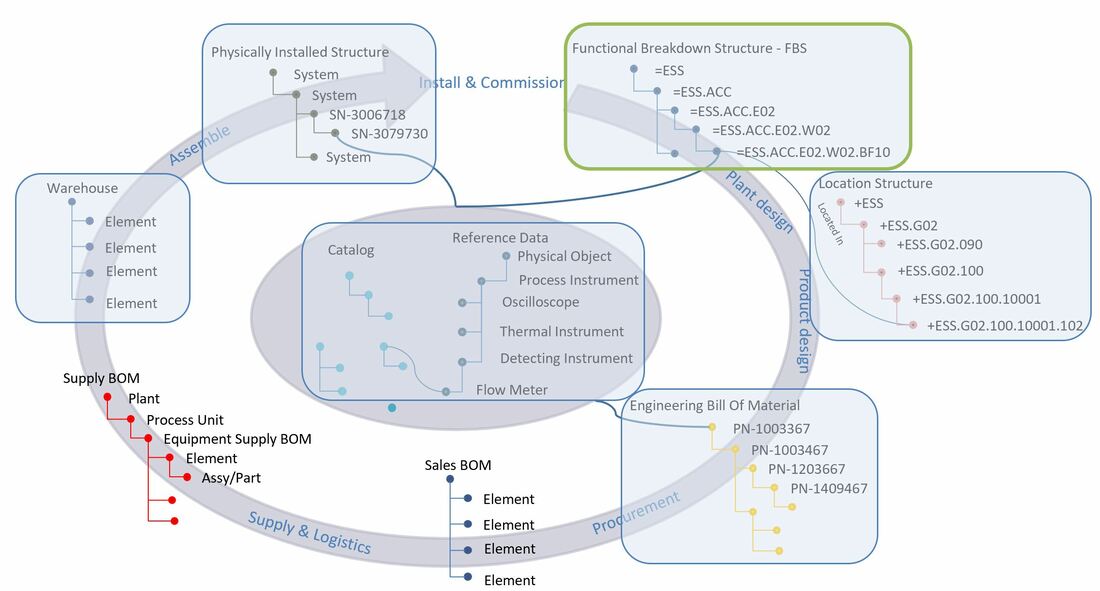
The location structure is a decomposition of physical locations of areas into buildings, levels, rooms, cells and sub-cells. The Location Breakdown Structure contains a consolidated view of all data from a physical location perspective.
This chapter is built up much the same way as the previous one about the functional breakdown structure, due to their similar look and feel, even though they describe different aspects of the facility.
If you would like to read previous chapters first before we take a deeper dive, you can find it here:
PLM tales from a true megaproject Ch. 1
PLM tales from a true megaproject Ch. 2 – Functional Breakdown Structure
If you’d like to familiarize yourself more with the concepts of the different structures, please visit:
Plant Information Management - Information Structures
In this chapter we are going to take a look at how the location breakdown structure is implemented at the European Spallation Source.
The location structure is a decomposition of physical locations of areas into buildings, levels, rooms, cells and sub-cells. The Location Breakdown Structure contains a consolidated view of all data from a physical location perspective.
This chapter is built up much the same way as the previous one about the functional breakdown structure, due to their similar look and feel, even though they describe different aspects of the facility.
If you would like to read previous chapters first before we take a deeper dive, you can find it here:
PLM tales from a true megaproject Ch. 1
PLM tales from a true megaproject Ch. 2 – Functional Breakdown Structure
If you’d like to familiarize yourself more with the concepts of the different structures, please visit:
Plant Information Management - Information Structures
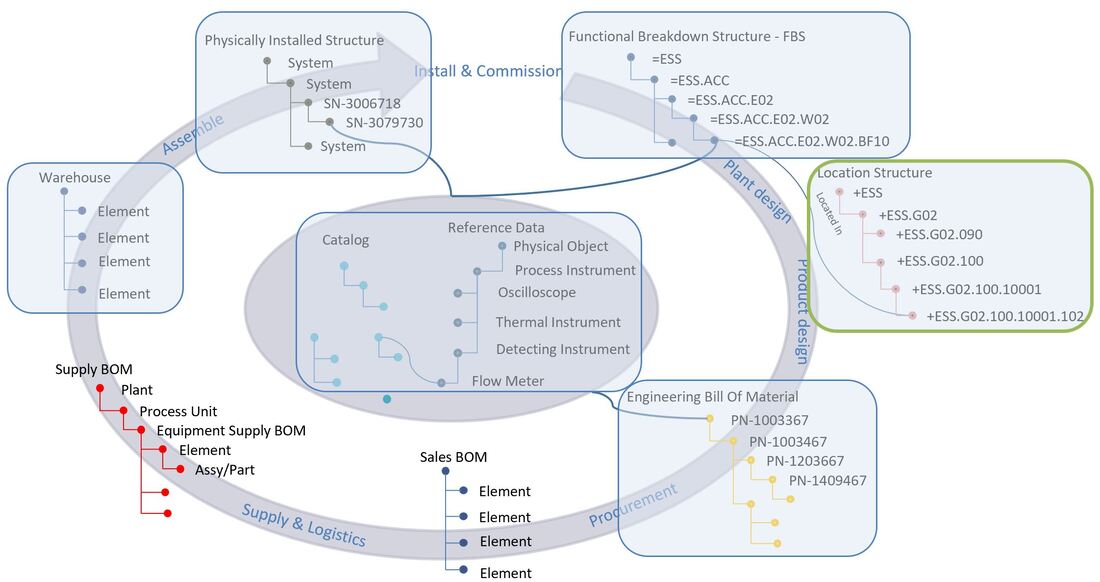
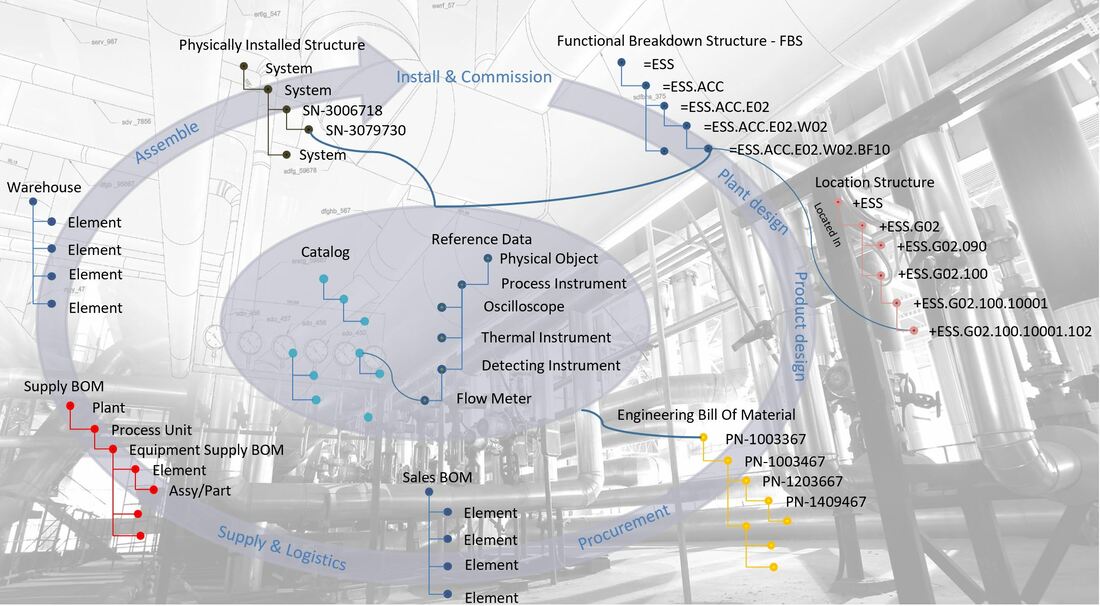
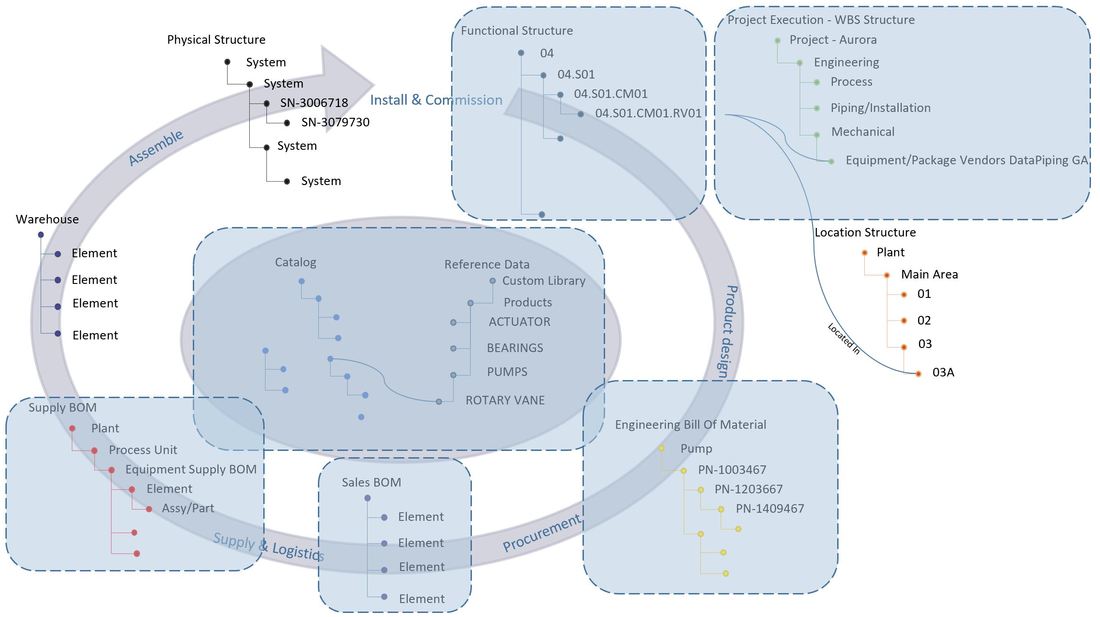
Figure 1.
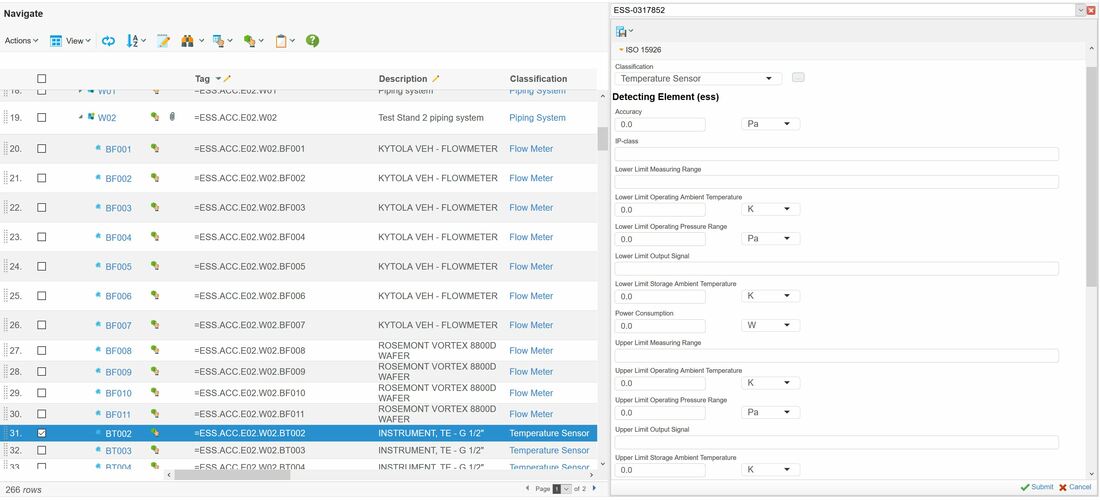
When examining the location breakdown structure, you’ll notice that is looks like it also has a form of tag.
This is entirely correct, the standard used at ESS, EN/ISO 81346, was among other things selected for its ability to name multiple aspects, where the functional aspect is indicated with a equal sign, and the location aspect is indicated with a plus sign.
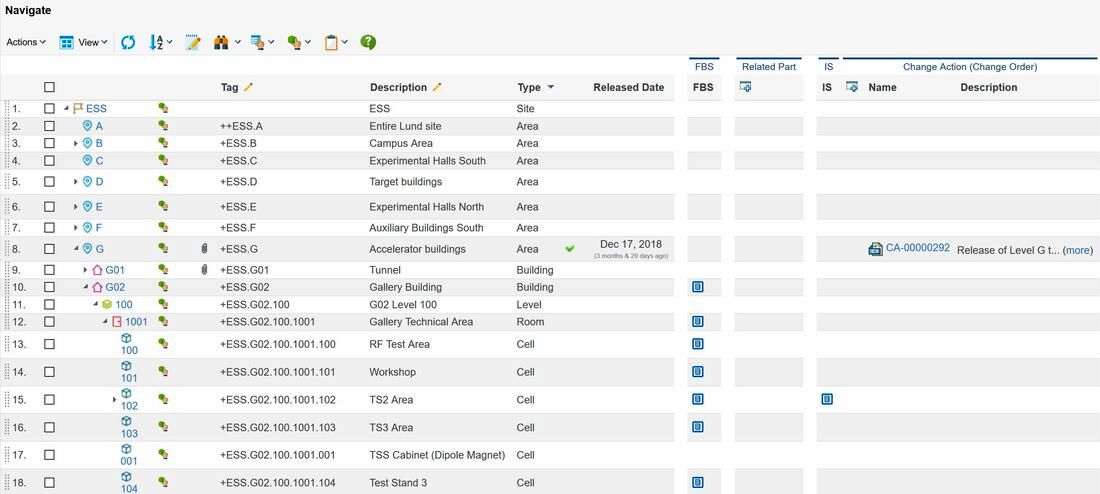
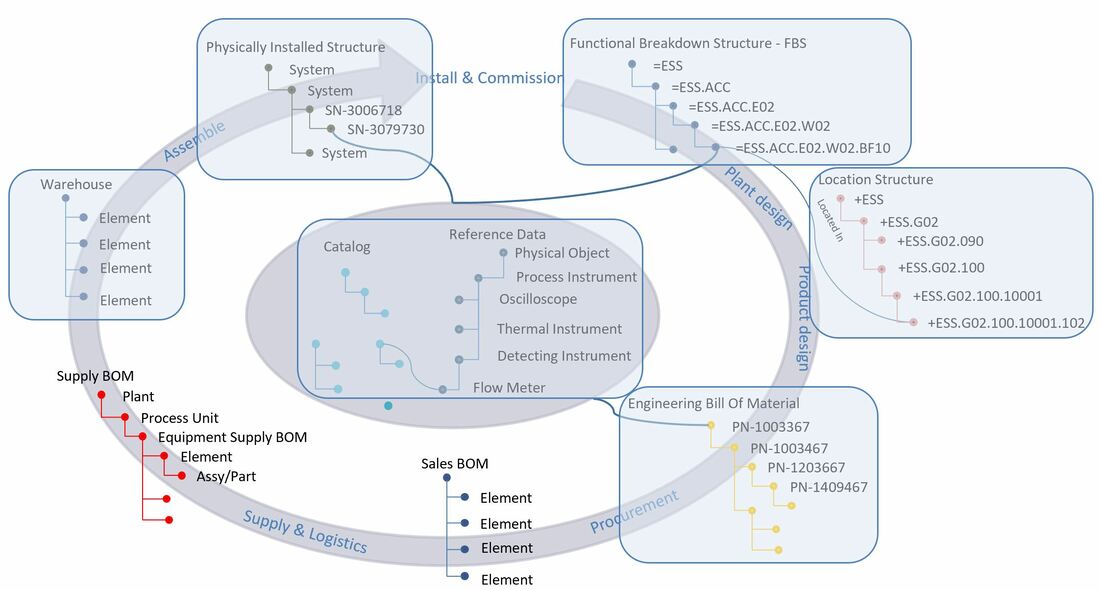
Figure 2. Image courtesy of European Spallation Source ERIC
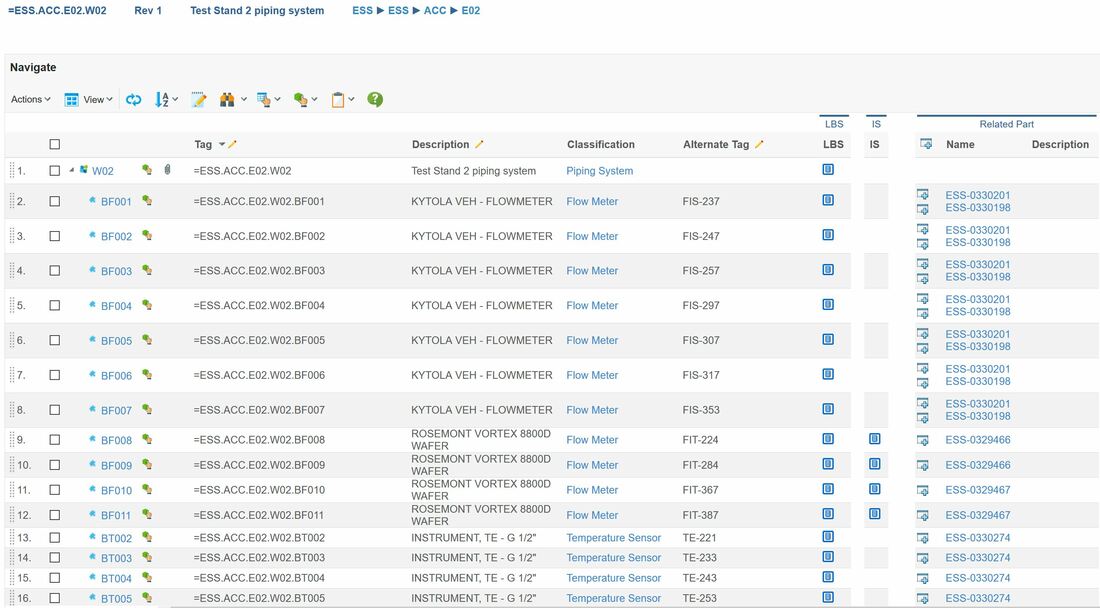
The image above is from the plant PLM system and shows a small part of the location breakdown structure at ESS.
Let’s go through what we see in the image, and use the TS2 Area (Test Stand 2) row 15 – +ESS.G02.100.1001.102 as an example.
The image above is from the plant PLM system and shows a small part of the location breakdown structure at ESS.
Let’s go through what we see in the image, and use the TS2 Area (Test Stand 2) row 15 – +ESS.G02.100.1001.102 as an example.
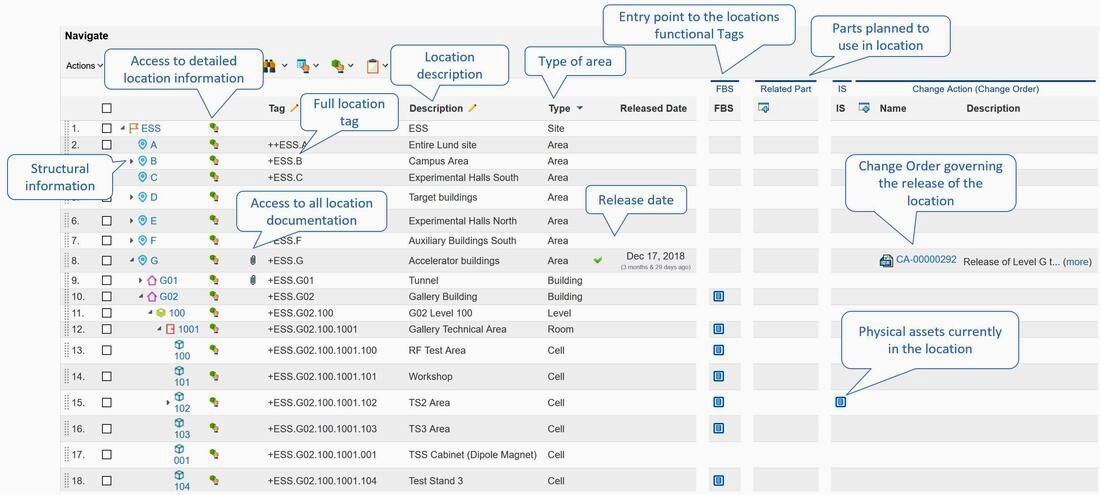
Figure 3. Image courtesy of European Spallation Source ERIC
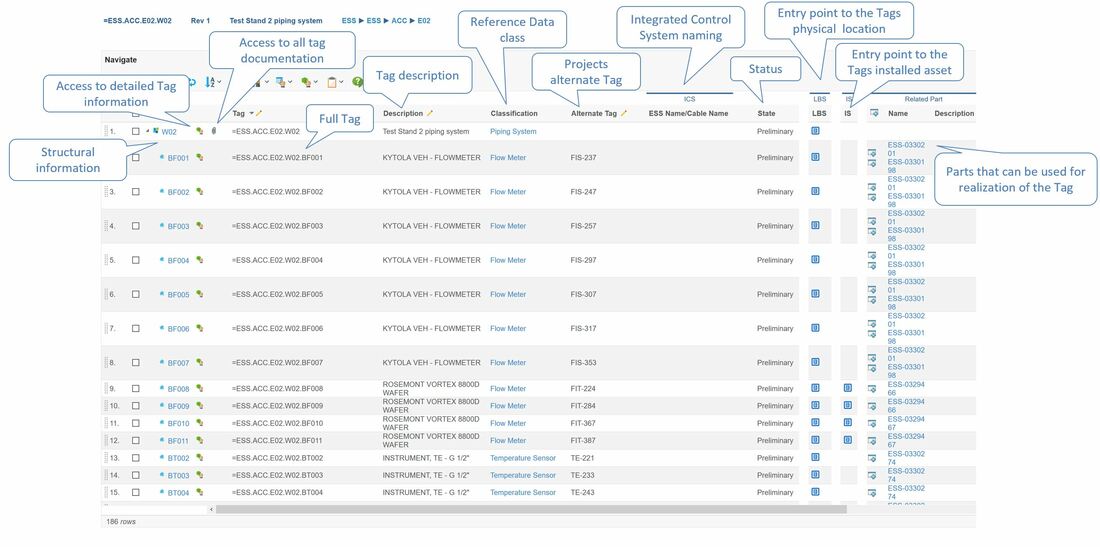
The first column shows the location name of the individual location object.
The second column with the little green icon gives you the option to zoom in on the location if further details are needed, for instance attribute values of the location such as owner of the location, status, specifications, reference documents, history etc.
The third column shows a paperclip if there are specifying documentation associated with the location. In figure 4 we can see that the Tunnel has 308 documents associated whereas 271 of them are considered specifying documentation to the location and 7 are requirement specifications (the green check mark means that it has the lifecycle state released). We can also see that 37 documents are regarded as reference documents. This means that they are describing the location, but are not regarded as specifying to the location.
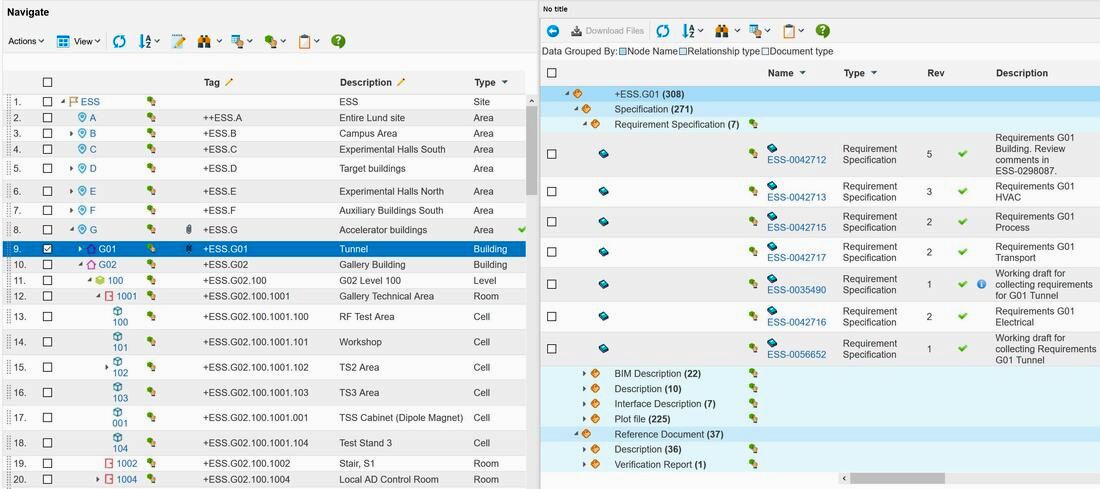
Figure 4. Image courtesy of European Spallation Source ERIC
The Tag column shows the full location tag , and the description column indicates a description of the location.
The type column indicates the type of area. At ESS this can be area, building, level (where 100 is floor level), room, cell and sub cells.
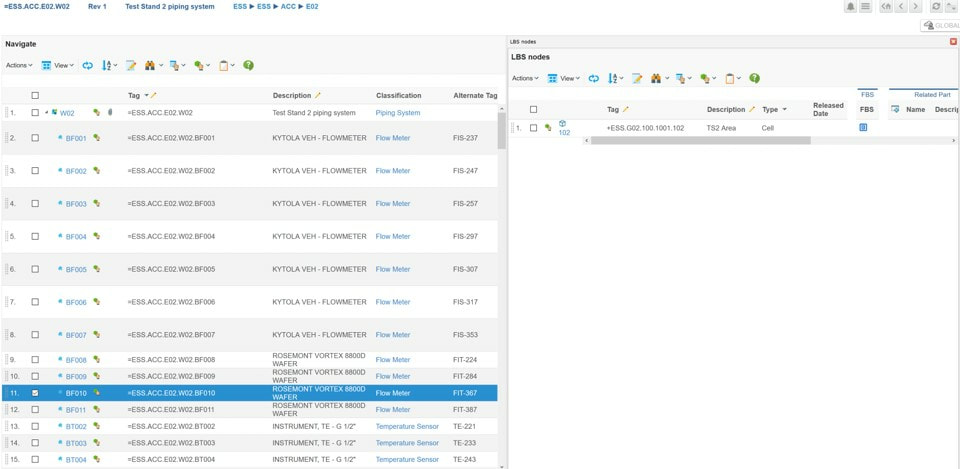
The FBS (Functional Breakdown Structure) column in figure 3 allows you to see at what functional locations, so Tags, the physical location actually contains. The functional locations are displayed in the split view as shown in figure 5.
The Tag column shows the full location tag , and the description column indicates a description of the location.
The type column indicates the type of area. At ESS this can be area, building, level (where 100 is floor level), room, cell and sub cells.
The FBS (Functional Breakdown Structure) column in figure 3 allows you to see at what functional locations, so Tags, the physical location actually contains. The functional locations are displayed in the split view as shown in figure 5.
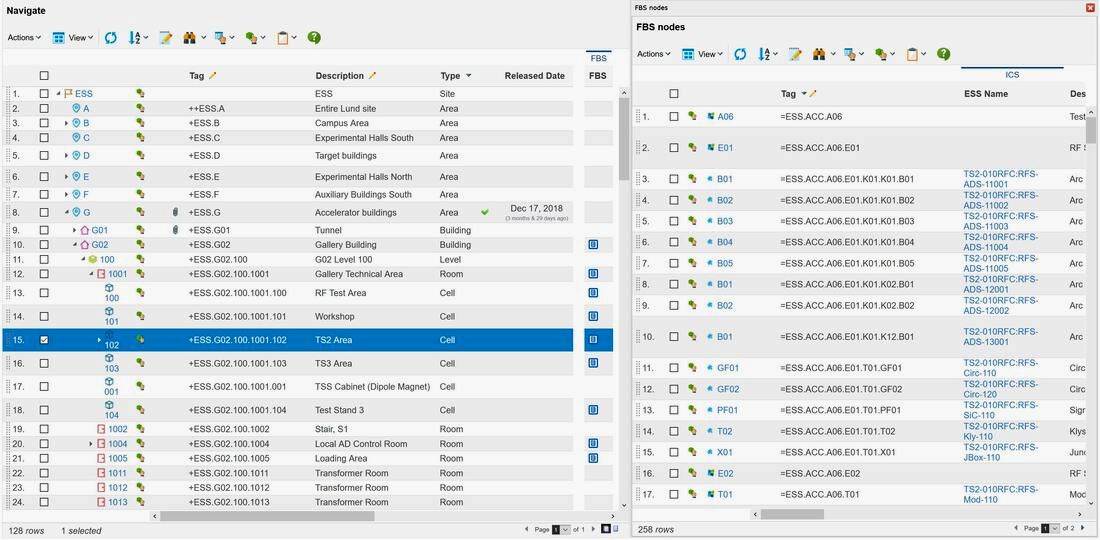
Figure 5. Image courtesy of European Spallation Source ERIC
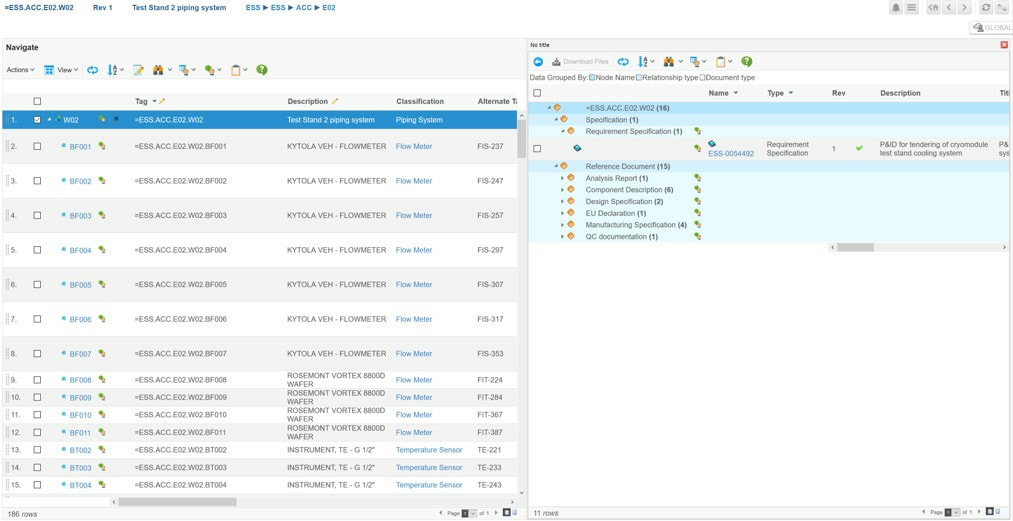
We can clearly see that the TS2 Area currently contains 258 functional tags (master tags), and all information regarding each functional tag is directly available in this view.
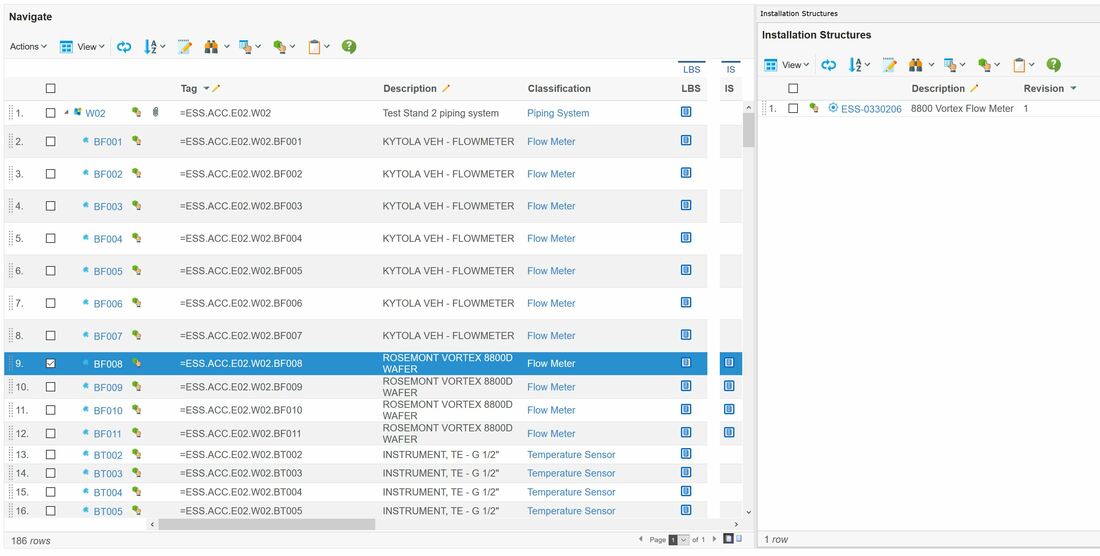
The IS column in figure 3 refers to the actually installed assets in the plant that is used to implement the functional object requirements that are located in the physical location of TS2 Area (an asset is a physical thing that typically has a serial number). See figure 6.
We can clearly see that the TS2 Area currently contains 258 functional tags (master tags), and all information regarding each functional tag is directly available in this view.
The IS column in figure 3 refers to the actually installed assets in the plant that is used to implement the functional object requirements that are located in the physical location of TS2 Area (an asset is a physical thing that typically has a serial number). See figure 6.
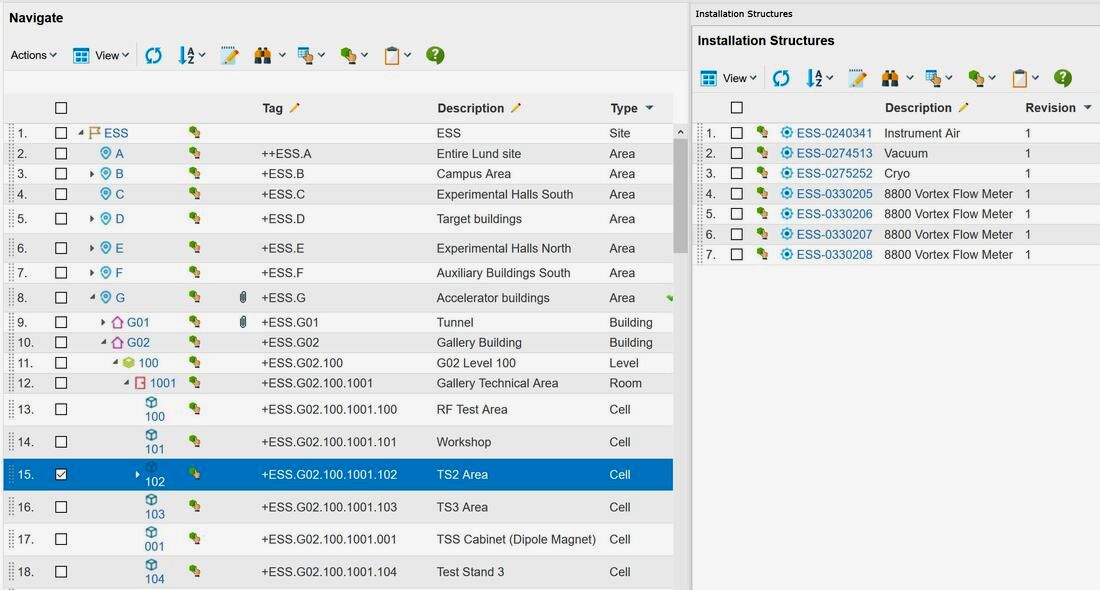
Figure 6. Image courtesy of European Spallation Source ERIC
The released part column in figure 3 gives an overview of what released product designs (Engineering Bill Of Materials) or standard parts that can fulfill the functional object requirements physically located in the TS2 Area (there might be several options prior to procurement, however the installed asset will only have an association to one part as it was manufactured based on that particular product design).
The last column in figure 3, called Change Order displays a link to the Change Order responsible for releasing the physical location together with all specifying documentation.
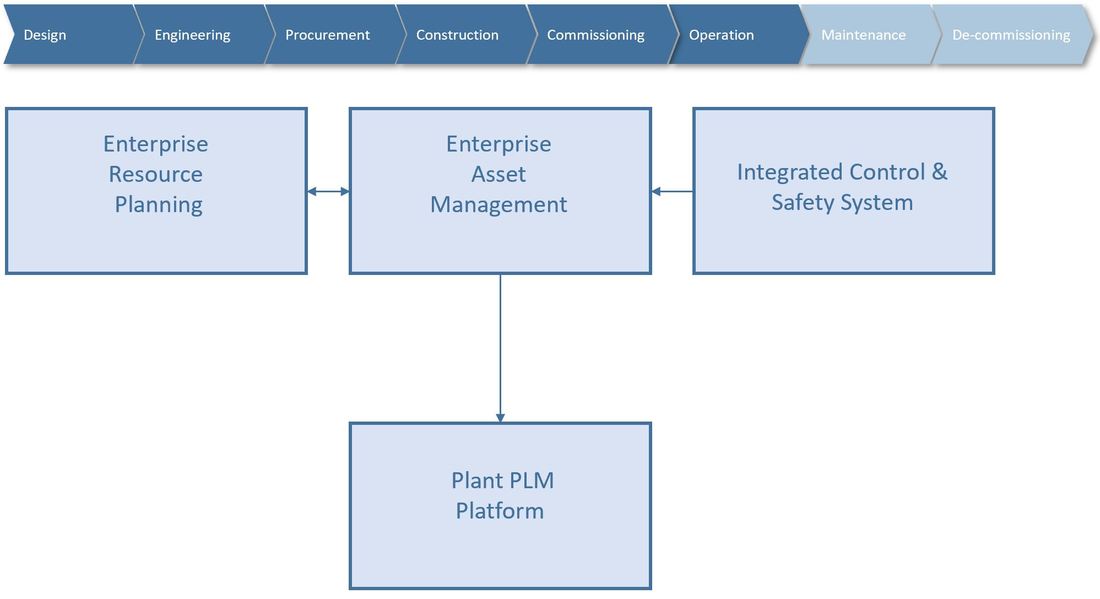
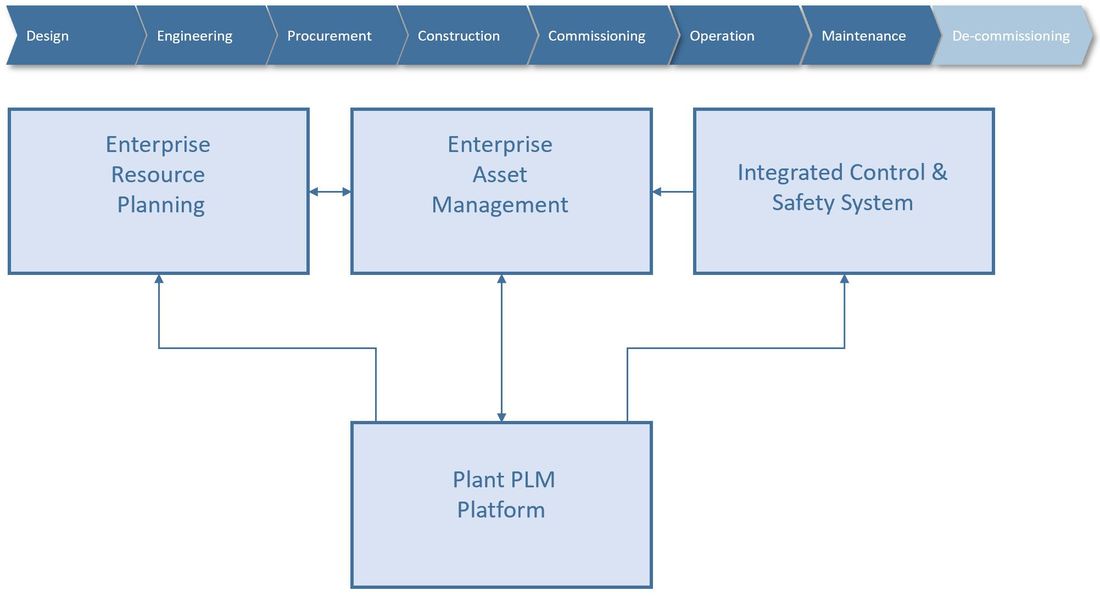
So, from one view in the plant PLM system, the European Spallation Source is able to access all related data to all physical locations in their location breakdown structure from engineering and design through installation, commissioning, operations, maintenance and ultimately decommissioning.
The next chapter will be about how ESS manages product design (Engineering Bill Of Materials), both from an Engineer To Order perspective and a serial manufacturing perspective.
It is my hope that this article can serve as inspiration for other companies as well as software vendors. I also want to express my gratitude to the European Spallation Source and to Peter Rådahl, Head of Engineering and Integration department in particular for allowing me to share this with you.
Bjorn Fidjeland
The released part column in figure 3 gives an overview of what released product designs (Engineering Bill Of Materials) or standard parts that can fulfill the functional object requirements physically located in the TS2 Area (there might be several options prior to procurement, however the installed asset will only have an association to one part as it was manufactured based on that particular product design).
The last column in figure 3, called Change Order displays a link to the Change Order responsible for releasing the physical location together with all specifying documentation.
So, from one view in the plant PLM system, the European Spallation Source is able to access all related data to all physical locations in their location breakdown structure from engineering and design through installation, commissioning, operations, maintenance and ultimately decommissioning.
The next chapter will be about how ESS manages product design (Engineering Bill Of Materials), both from an Engineer To Order perspective and a serial manufacturing perspective.
It is my hope that this article can serve as inspiration for other companies as well as software vendors. I also want to express my gratitude to the European Spallation Source and to Peter Rådahl, Head of Engineering and Integration department in particular for allowing me to share this with you.
Bjorn Fidjeland


 RSS Feed
