So why this strong focus on structured and connected data? Throughout the different chapters we’ve looked into the details of how the European Spallation Source have defined data structures needed throughout the lifecycle of the facility, and how interoperability between connected objects across those data structures is achieved by utilizing governed and shared master data.
If you would like to read previous chapters first before we take a deeper dive, you can find them all here: Archive
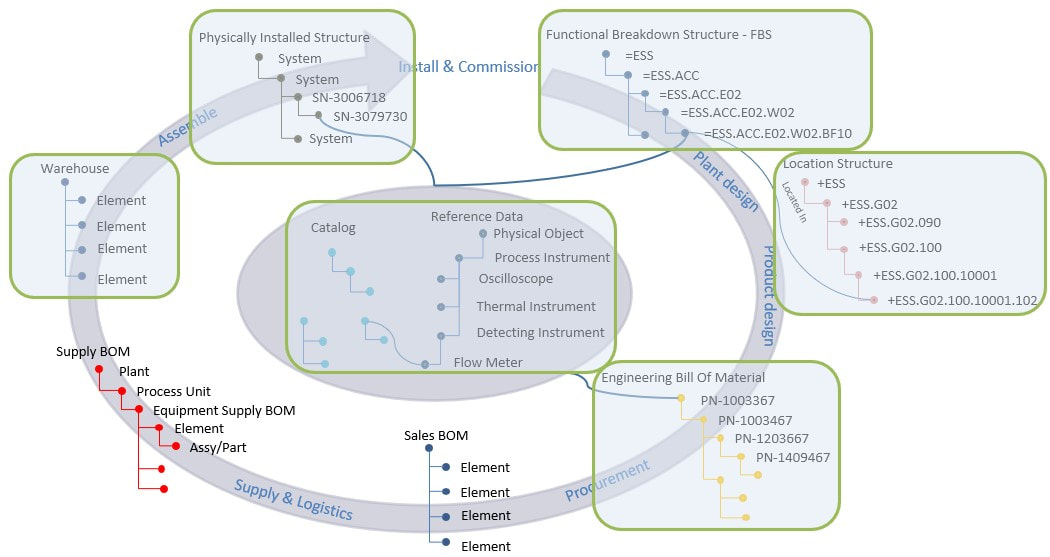
The figure below shows an overview of where ESS have put their focus in terms of structured data.
But why? What is the overall objective?
The main objective is to support the evolution from project to a sustainable facility enabling world leading science for more than 40 years, and to establish the foundation needed for cost-efficient operation and maintenance. High up-time and tough reliability requirements together with tight budgets fosters a need to re-use and utilize data from all stakeholders in the project across the full facility lifecycle.
By structuring and connecting data in the way described in this article series, ESS obtains traceability and control of all the facility data, which is vital from a regulatory perspective as we saw in chapter 1, but will also be crucial to obtain effective operations and maintenance.
But where does the digital twin fit into all of this?
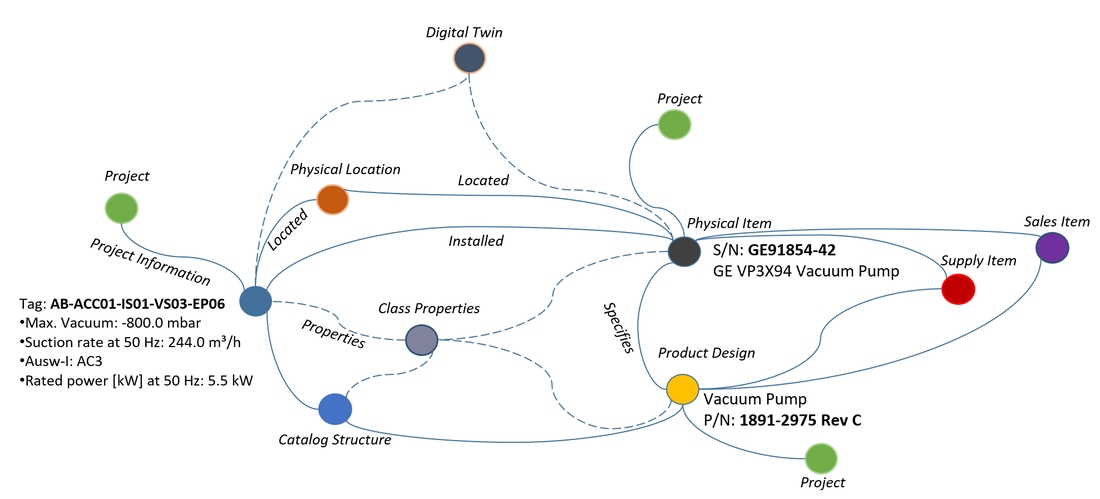
In my view, the digital twin is in fact all the things we’ve been looking into in this article series, and the fact that the data is all linked together, navigable and comparable. This means that if I’m in operations I can interrogate any function (tag) in the facility for its physical location, to what system it is a part of, the design of that particular system, the asset that is implementing the function in the facility and all its data (the actual physical product in the facility), the full maintenance history of that asset and when it is next scheduled for maintenance, what part the asset was sourced from including its design data, the manufacturer of the part and so forth.
Another example would be going to a part and see all the functions (tags) in the overall facility where this part is used to fulfill a function from facility design perspective, or how many physical assets there are in the facility and in the warehouse sourced from this part.
A third example would be to interrogate a physical asset to see if there are similar ones as spare parts in the warehouse, how long the asset has served at that particular functional location, whether there are any abnormal readings from any of its sensors, when it’s scheduled for maintenance or if it has served at any other functional locations during its lifetime.
It is not strictly necessary that the digital twin has a glossy three-dimensional representation. At least I sometimes get the feeling that some companies tend to focus a lot on this aspect. And that’s exactly what it is, only one aspect of the digital twin. Most of the other aspects are covered in this article series, and yes there are other aspects as well depending on what kind of company you are, and what needs you have.
The common denominator however is that data must be linked, navigable and comparable.
Figure 3 shows what kind of data the digital twin can consist of, provided that the data is structured and connected. A three-dimensional representation is in itself of limited value, but if connected to underlying data structures it would be a tremendously good information carrier, allowing an end user to quickly orientate herself or himself in vast amounts of information. However, it is not a pre-requisite.
I once, with another client, came across an absolutely fantastic 3D model of a facility to be used for operations. It was portrayed as a digital twin, but the associated data (design together with actual installed and commissioned assets) where all PDFs. My question was: If all the data is in PDFs and not as data objects and real attribute values, how can it be utilized by computer systems for predictive maintenance? For instance, how can data harvested from sensors in the field via the integrated control and safety system be compared to design criteria’s, and historical asset data to determine whether the readings are good or bad?
It could not.
To their defense, there were initiatives in place to look into other aspects and to start structuring data, but they focused on the 3D first.
In my view, the problem with such an approach is that it gives a false sense of being done when the 3D representation is in place. Basically, this would only represent the location aspect we discussed in chapter 3, only just in three dimensional space. You might argue that it could also include spatial integration discussed in chapter 5, but I would respond that a lot more structured data and consolidation of such data is needed to achieve this.
The thing is…. In order to achieve what is described in this article series, most companies would have to change the way they are currently thinking and working across their different departments, which brings us to the fact that real business transformation would also be required. The latter is most of the time a much larger and more time-consuming obstacle than the technical ones because it involves a cultural change.
If you would like to read even more about my thoughts around the Digital Twin, please read:
Digital Twin – What needs to be under the hood?
It is my hope that this article series can serve as inspiration for other companies as well as software vendors. I also want to express my gratitude to the European Spallation Source and to Peter Rådahl, Head of Engineering and Integration department in particular for allowing me to share this with you.
Bjorn Fidjeland


 RSS Feed
